
Prices gapped lower at the open (a), formed an upward sloping channel but ran into upside resistance at the 200 minute EMA. Prices then took a nosedive (c) on extremely heavy volume. Prices attempted two small rallies (e and f) but sold off into the close (g) on heavy volume (h). End of the day, heavy volume sell-offs are very bearish; they indicate a high level of concern for negative news coming out overnight.
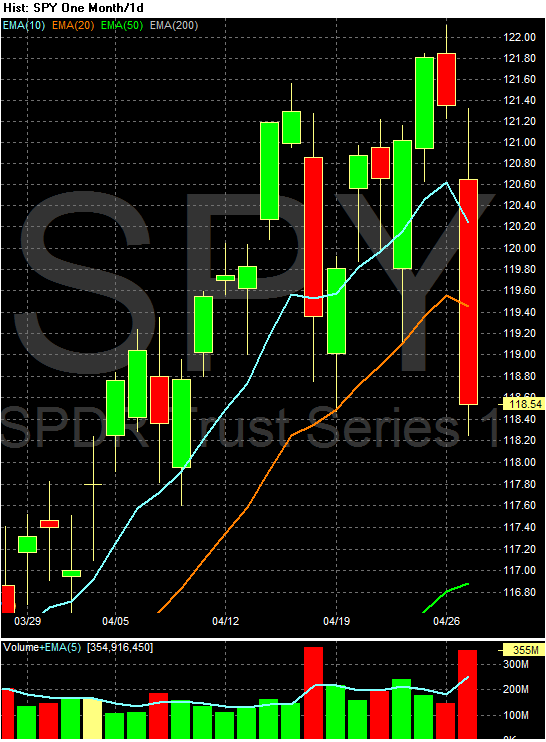
Notice the very large bar that went through the 10 and 20 day EMA on very high volume. These are both important technical events.
Notice the more of less same patterns with the IWMs (Russell 2000) BUT the daily chart did not take out two EMAs.


Let's move onto the bond market. First, notice that all sectors of the market rallied yesterday -- and all moved through important resistance levels.


Notice that the long end of the curve (the TLTs) saw a massive influx of money -- the volume spike is huge. This is a very important move as it indicates traders are either, a.) unconcerned about inflation or, b.) don't think interest rates will by rising anytime soon.
What is very interesting about the above move in the Treasury market is also dealing with two other issues. The first is fundamental -- there is a ton of supply hitting the market this year. While there is talk of the total amount of debt being less than anticipated, there is still a lot of debt coming to market. More importantly, there are several large auctions this week. So, the threat of a Greek default and/or the need for safety is stronger then the concern about supply. Also note the US is now considered a safe haven relative to Europe -- this in spite of deficit concern.
Secondly, the Treasury market is at very important long-term levels. Consider this chart

The multi-year chart shows a clear head and shoulders pattern at the long end of the curve, which is at the end of a 30 year bond rally that has sent rates to multi-generational lows. It's certainly not unheard of for short-term market issues to take control of multi-year patterns. However, it's important to remember that the short-term issue is taking control of the market right now.
Let's take a look at the dollar:

Yesterday, prices gapped higher at the open (a) and then rallied (b) with some impressive volume spikes (c). Prices then sold off in a disciplined manner, only to rally again (d) with impressive volume inflows at the end of trading (e).

The daily chart shows a strong uptrend in place, along with a very bullish EMA picture -- all the EMAs are rising, the shorter EMAs are above the loner EMAs and prices are above the EMAs. Finally, prices are near important resistance levels. This charts tells us the dollar is still considered a safe-haven currency.

On the long term chart, prices are right at the 200 week EMA -- a very important technical level.
Let's sum up:
1.) The markets took a massive , fundamental his yesterday. However, as I've noted a few times (for example see this post and this post), the market is over-extended and needed to pull back from current levels.
2.) The bond market is a clear winner. On the flip side, however, are two issues: first, interest rates are really low, meaning traders have made some decent profits. When will they start to take them? Second, there is still the issue of supply. While yesterday's action clearly changed the short-term perception in the market, how long will that last in reference to the US' continued need to borrow large sums of money?
3.) The dollar is now a safe haven currency, largely at the euro's expense. But the dollar is at very important weekly technical levels (the 200 week EMA). We need to see how prices move through this level.