
Notice the following on the SPYs chart:
-- Prices have been in a rally since the beginning of the March
-- The 10 and 20 day SMA are moving higher
-- The 10 and 20 day SMA have moved through the 50 day SMA
-- Prices are above all the SMAs
-- Prices have moved through key resistance levels

Notice the following on the QQQQs
-- Prices have been moving higher since the beginning of March
-- Price have moved through key resistance levels
-- Prices are above all the SMAs
-- The shorter SMAs are above the longer SMAs
-- All the SMAs are moving higher

Notice the following on the IWMs chart:
-- Price have been moving higher since early March
-- Prices are above all the SMAs
-- The 10 and 20 day SMA are moving higher
-- The 10 and 20 day SMA have moved through the 50 day SMA
Technically, the market are in an upswing. In fact all three charts are moving into a technically very bullish orientation. The problem I am having is the fundamental picture is still very questionable. Over the weekend I wrote an article for the Huffington Post which I will reprint below in its entirely. The bottom line is the fundamentals are still terrible.
Several important economic people have publicly stated they see the economy getting better. Over the last several weeks, Larry Summers said he has heard anecdotal information that things are improving. President Obama made similar statements recently as did Fed Chairman Ben Bernanke. The question is, "does the data back up this assertion?"
Let's start with employment. Here is a chart from the St. Louis Federal Reserve of the year over year percentage change in establishment employment:
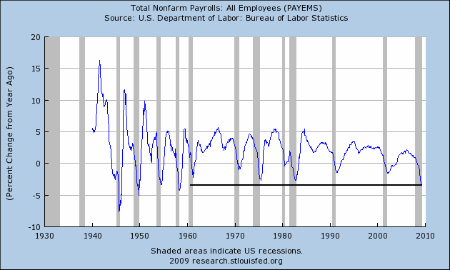
Notice the rate of job destruction is increasing. In fact, we have not seen the current rate of job destruction on a year over year basis since the last 1950s. Also note the median duration of unemployment is still increasing:
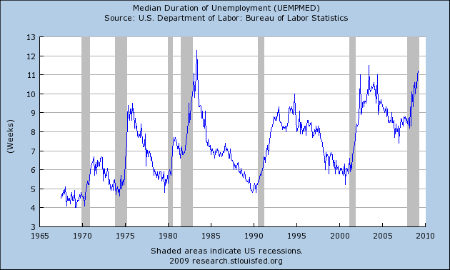
This indicates it is still incredibly hard to find a job once a job is lost. This tells us the rate of job creation is still slow -- at best. In addition,
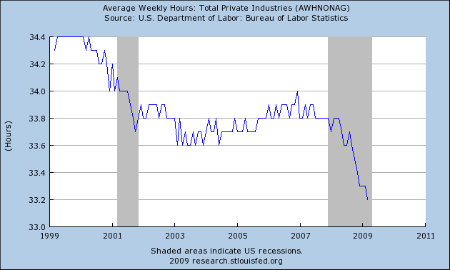
Average weekly hours is decreasing, which tells us employers are still under pressure to cut margins.
The conclusion from employment data is things are not getting better: the rate of job destruction is still high, the median duration of unemployment is increasing and the hours worked are decreasing.
Let's look at industrial production. The latest report from the Federal Reserve painted a bleak picture:
Industrial production fell 1.5 percent in March after a similar decrease in February. For the first quarter as a whole, output dropped at an annual rate of 20.0 percent, the largest quarterly decrease of the current contraction. At 97.4 percent of its 2002 average, output in March fell to its lowest level since December 1998 and was nearly 13 percent below its year-earlier level. Production in manufacturing moved down 1.7 percent in March and has registered five consecutive quarterly decreases. Broad-based declines in production continued; one exception was the output of motor vehicles and parts, which advanced slightly in March but remained well below its year-earlier level. Outside of manufacturing, the output of mines fell 3.2 percent in March, as oil and gas well drilling continued to drop. After a relatively mild February, a return to more seasonal temperatures pushed up the output of utilities. The capacity utilization rate for total industry fell further to 69.3 percent, a historical low for this series, which begins in 1967.
This report is cause for great concern. Output dropped 20% in the first quarter. While auto manufacturing is responsible for a large percentage of this, it's not the only problem. Here is a chart of the year over year percentage change in industrial production:
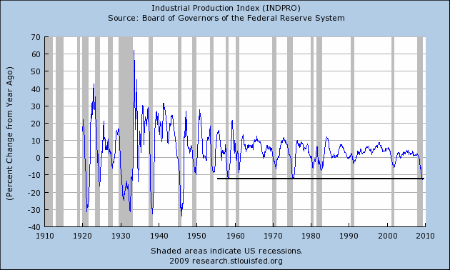
Notice the percentage year over yeare drop has not been this bad since the late 1950s. Also note the capacity utilization is now at incredibly low levels:
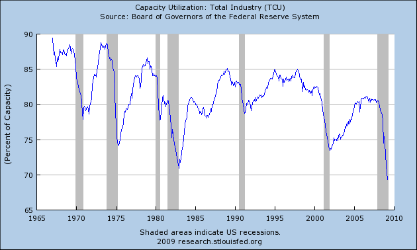
This tells us that when the economy picks up it wont' be from investment because there is already a large amount of idle capacity in the system.
Despite the recent uptick in new home sales, the housing market is still a mess. The most important metric to watch is housing prices which are still dropping at alarming rates:
Home-price declines in many of the largest U.S. cities accelerated in January, according to a closely watched index, offering a grim reminder that the housing market remains in a deep contraction despite recent glimmers of stability.
The S&P Case Shiller Index, which tracks prices in 20 metropolitan areas, fell 19% for the three-month period ended in January, compared with the year-earlier period. The decline, which follows a 18.5% decline for the three-month period ended in December, was a record annual rate of decline.
Once the year over year price declines fall to declines of 3% to 5% then we'll be able to say that housing is nearing a bottom. But until that time we're nowhere near a bottom in housing.
And the drop in housing wealth is one asset whose price drops have hit consumers hard. The other is obviously stock prices. Since the second quarter of 2007, household net worth has decreased from $64.361 trillion to $51.476 trillion -- a drop of 20%. That's leading to a drop in retail sales. Here's a chart of the year over year decline in real (inflation adjusted) retail sales:
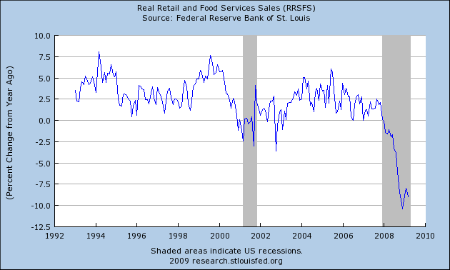
There was some excitement about the February uptick. But the latest report showed a decrease:
The U.S. Census Bureau announced today that advance estimates of U.S. retail and food services sales for March, adjusted for seasonal variation and holiday and trading-day differences, but not for price changes, were $344.4 billion, a decrease of 1.1 percent (±0.5%) from the previous month and 9.4 percent (±0.7%) below March 2008. Total sales for the January through March 2009 period were down 8.8 percent (±0.5%) from the same period a year ago. The January 2009 to February 2009 percent change was revised from -0.1 percent (±0.5%)* to +0.3 percent (±0.3%)*.
Retail trade sales were down 1.1 percent (±0.7%) from February 2009 and 10.7 percent (±0.7%) below last year. Gasoline stations sales were down 34.0 percent (±1.5%) from March 2008 and motor vehicle and parts dealers sales were down 23.5 percent (±2.3%) from last year.
While it's important to be hopeful about things overall, the underlying data does not support the conclusion that things are getting better. IN fact, I think the the best conclusion to draw comes from the latest Beige Book:
Reports from the Federal Reserve Banks indicate that overall economic activity contracted further or remained weak. However, five of the twelve Districts noted a moderation in the pace of decline, and several saw signs that activity in some sectors was stabilizing at a low level.
Traders are looking at the glimmers of hope out there rather than the actual numbers. There is nothing wrong with this: in fact, it's standard market behavior. But, it doesn't mean the rally has continued legs either.