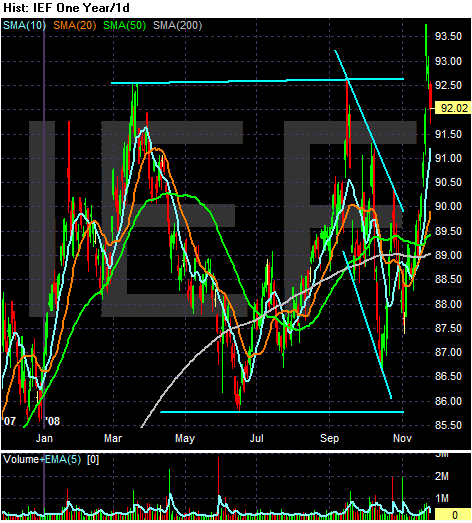
Although the yearly chart shows the 7-10 year section of the yield curve has been in a rally since mid-October, also note this section of the market rallied past the upper trend line but quickly retreated. The primary reason for this retreat over the last few days is the stock market rally -- as money flowed into equities it flowed out of the Treasury market. I also think that with the S&P 500 and 10 year Treasury at yield parity something had to give. I think the market sent Treasuries higher as a result.
While the market is clearly in a rally, I am wondering how strong the upside resistance to the Treasury market is. Right now the 10 year is yielding 3.21%. That seems to be a really low rate, especially with the new administration talking about a huge stimulus plan that will balloon Treasury supply.

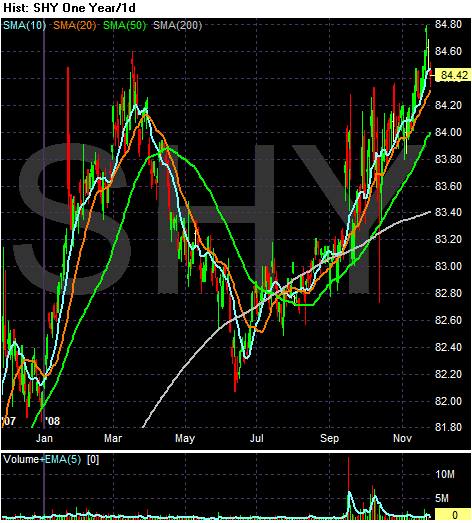
Above is a 6 month chart of the short end of the yield curve. Simply note it has been in a rally since late May. The bottom line is the credit crunch is still firmly in place according to this market.