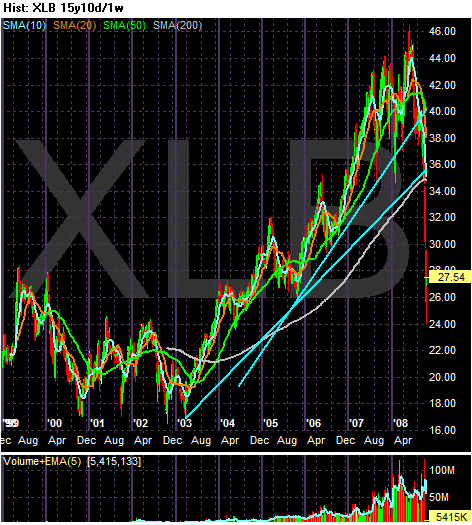
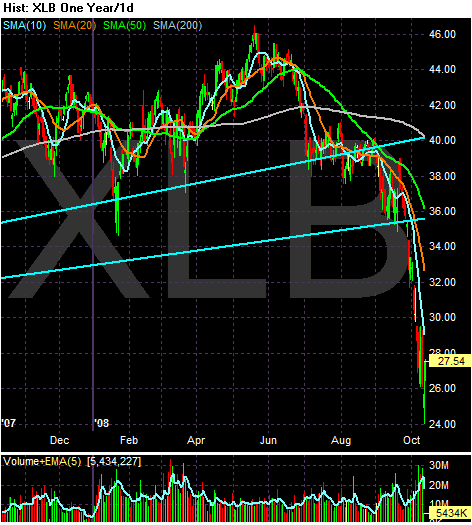
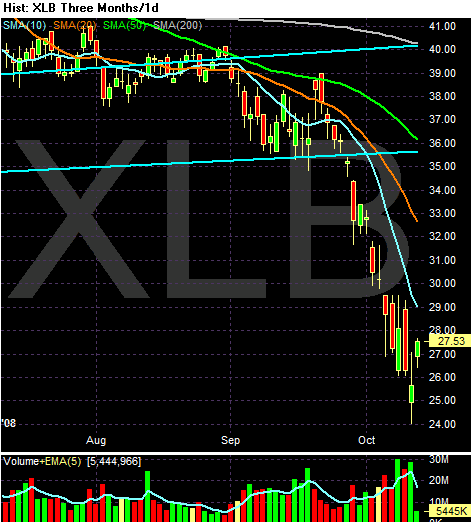
Let's start with the XLBs, which represent the basic materials sector of the market.

On the multi-year chart, the main point to notice is the sector has clearly broken the long-term trend lines that started in 2003.

On the yearly chart, notice the index was holding on even into August of this year. While it was declining at that time, it had only fallen by about 15%. While this isn't good, it certainly isn't horrible either. Also remember that global infrastructure development was a strong theme for most of the latest rally. It looks as though traders were hanging on to that idea for as long as possible. But when we started to hear news from Europe and Asia that they were slowing down, this sector became a portfolio liability.

On the three months chart, notice the following:
-- Prices are below the 200 day SMA
-- All the SMAs are moving lower
-- The shorter SMAs are below the longer SMAs
-- Prices are below all the SMAs
Bottom line -- this is now a bearish chart.