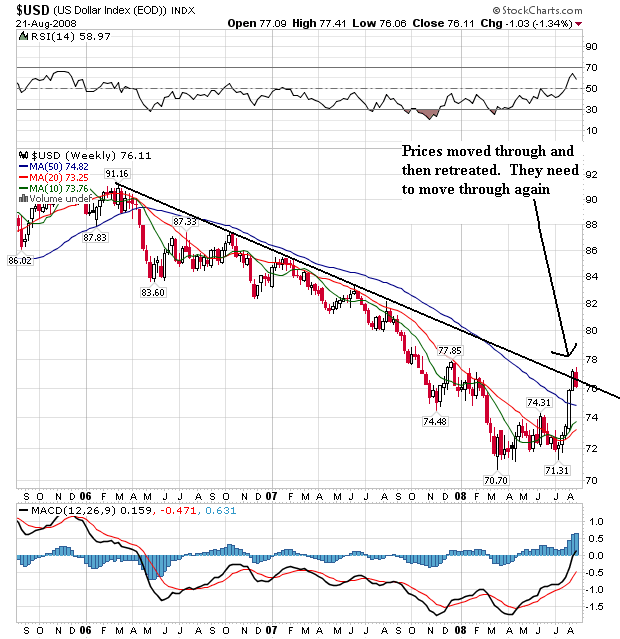
On the weekly chart, notice the following:
-- The dollar broke through the downward sloping trend line that started at the beginning of 2006. That's a big development because it adds further evidence to the "trend reversal" argument. However, prices have fallen back through the line this week. It's possible we'll see prices gyrate around this very important level as traders decide how much higher they want to send the dollar. But for this to be a bona fide rally, the dollar must eventually move beyond this important technical indicator.
-- The 10 and 20 week SMA are both moving higher
-- The 10 week SMA crossed over the 20 week SMA
-- Remember the above two numbers are weekly numbers, so any change in trend is very important.
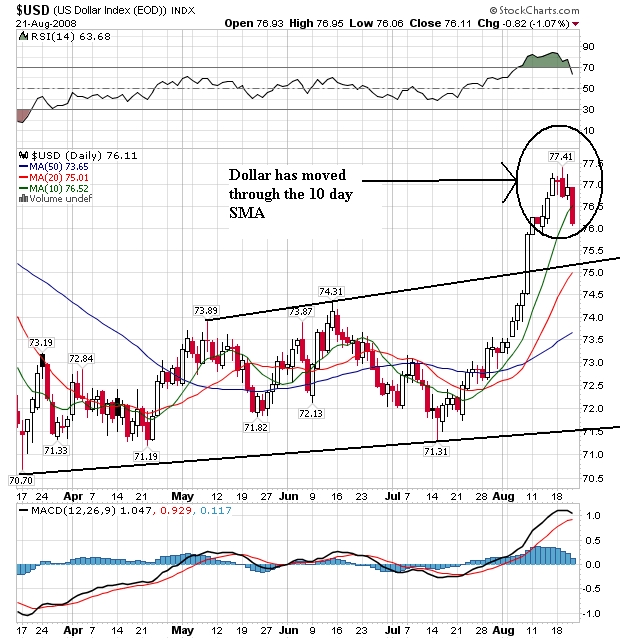
On the daily chart, notice the following:
-- All the SMAs are moving higher
-- The shorter SMAs are above the longer SMAs
-- Prices clearly broke through the upper trend line of the upward sloping trend channel.
BUT:
-- Prices have moved below the 10 day SMA in a fairly convincing fashion, indicating a short-term correction is probably underway. But corrections are standard in rallies, so it does not mean (in any way) that the rally is over.
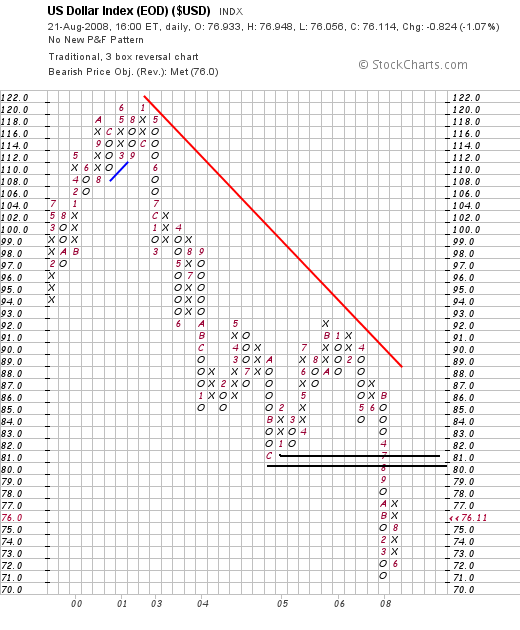
On the P&F chart, notice there is a great deal of resistance in the 80/81 area. That means there is plenty of upside room for prices to run at this point if they want to.
It's important to remember why the dollar is rallying right now. There are two fundamental reasons for people to buy a currency. Either the currency's interest rates are attractive relative to other currency's interest rates or the currency's economy is growing and therefore attractive for investment. The US does not have either fundamental development right now. From an interest rate perspective, notice the US' rates are not competitive compared to other rates:
And the US economy is not in a strong position:
The Labor Department's weekly tally of claims for unemployment benefits shows joblessness is at recessionary levels, while the Conference Board's index of leading indicators, released Thursday, dropped sharply last month, suggesting economic conditions will weaken further this year.
"A few months ago, there was some discussion about a second-half recovery," said Ken Goldstein, an economist with the Conference Board, a business research group based in New York. Now, "if there's a second-half recovery, it'll be the second half of 2009."
So -- why is the dollar rallying?
It's not. Instead, the euro is dropping.
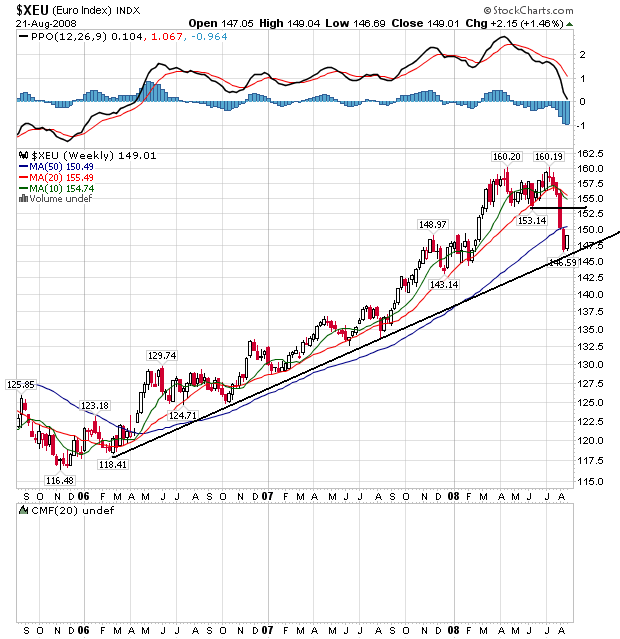
Notice the euro's chart is a mirror image of the dollar's chart. While the dollar has been dropping over the last two years, the euro has been the prime beneficiary of the drop. However, over the last few weeks, the euro has dropped about 7.8%, indicating there is a fundamental shift in the euro trade. That occurred when ECB President Trichet acknowledged the EU economy was weak and he might actually have to lower rates (or at least not raise them). In essence, be became an inflation dove overnight.
So -- we have a technical rally in the dollar caused by weakness in the euro, not strength in the US economy or higher US interest rates. As a result, the 80/81 price area on the dollar's PF chart looks like a really strong area of upside resistance to this rally.