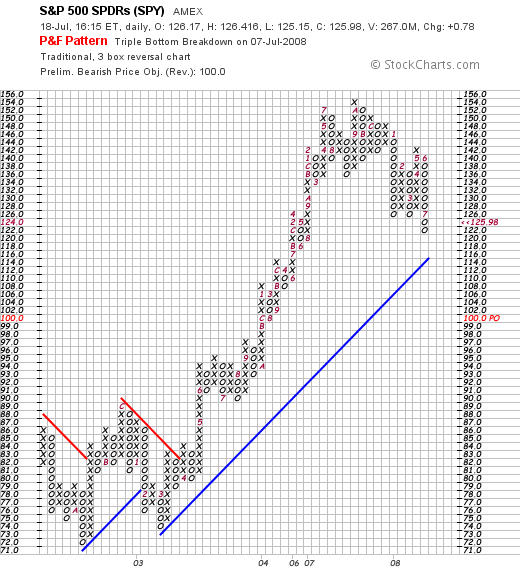
On the P&F chart, simply note there is no turnaround caused by last week's price action. None. We're still printing a bearish pattern where prices have broken through support and are moving lower.
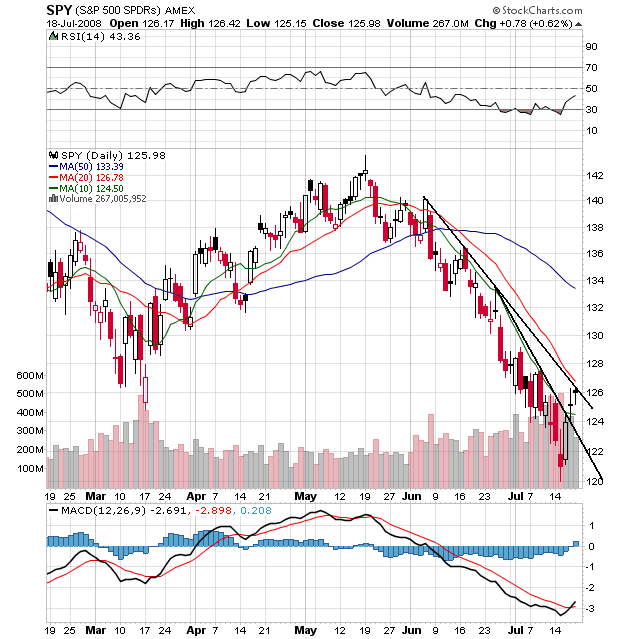
On the daily chart, notice the following:
-- The last two days the market printed two spinning tops -- candles with narrow bodies and long wicks. These are weak candles. They mean that there wasn't a great deal of intra-day action to move the markets higher; most of the gains came from the opening gap higher.
-- Prices are above the 10 day SMA but are running into resistance at the 20 day SMA
-- Prices have not broken though longer term resistance.
-- All the SMAs are still headed lower
-- The shorter SMAs are still below longer SMAs
-- Prices are below the 20 and 50 day SMA, but above the 10 day SMA
This is a chart that could continue to move higher. But the underlying technicals are not amazingly bullish right now.