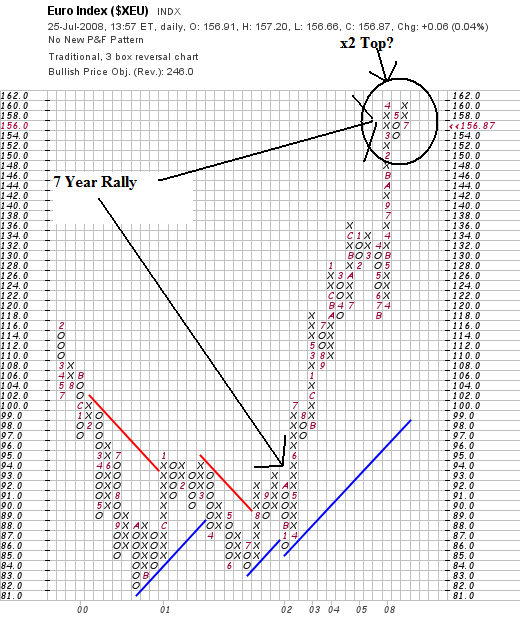
On the P&F chart, notice the following.
-- The euro has been rallying for the last 7 years. That's one hell of a rally.
-- The chart may be forming a double top.
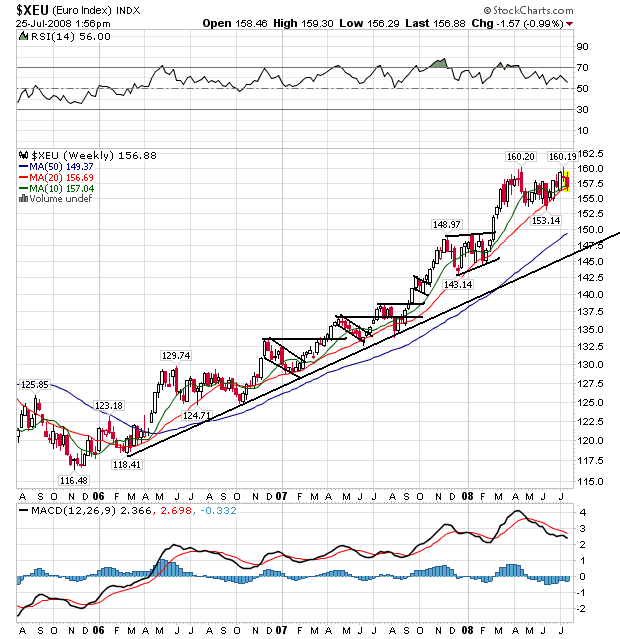
On the weekly chart, notice the strength of the multi-year rally. Prices have continually moved higher, going through levels of resistance and then consolidating gains. Also note that prices are consolidating or topping right now.
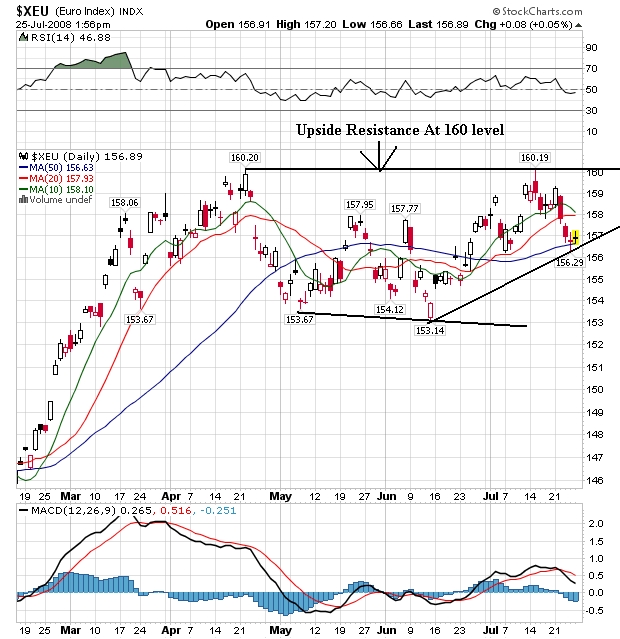
On the daily chart, notice that prices have had a hard time getting about the 160 level, which is providing a fair amount of upside resistance.