SPYs or S&P 500
First, I don't look at the Dow Jones Industrial Average. It's 30 stocks whereas the S&P 500 is 500 and represents a far larger swath of the market. In addition, I use the tracking stocks for all the averages.
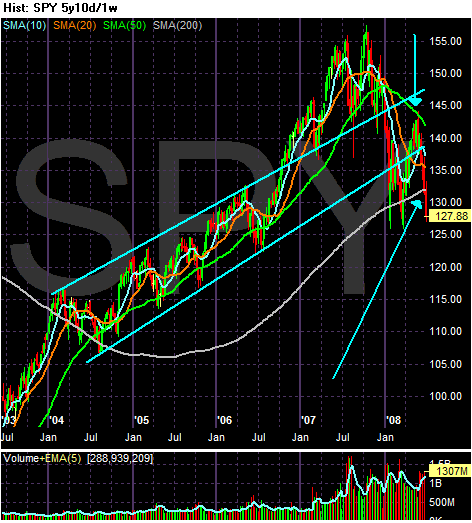
Let's start with the five year weekly chart. Notice the SPYs traded in un upward sloping channel since the beginning of 2004. They broke through the top trendline at the end of 2006 and bounced off this line at the end of the first quarter of 2007. Then the SPYs went to form a double top in 2007. In early July of last year Bear Stearns announced two of their hedge funds were in serious trouble and the credit crisis started. As a result, the SPYs fell through both of the trend lines of their upward sloping channel. In early 2008 they formed a double bottom, with the second bottom occurring when the Federal Reserve backstopped JP Morgan's purchase of Bear Stearns. Since then the SPYs have been rallying. However, over the last few weeks the SPYs have dropped hard moving through the lower trend line of the upward sloping channel the index originally formed in 2004.
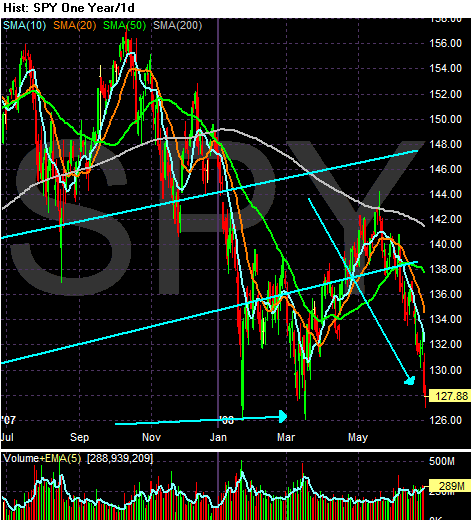
Above is a one year daily chart of the SPYs which I have included to better show the action over the last year. Notice the following:
-- Prices are below the 200 day simple moving average (SMA) -- bear market territory
-- Prices have dropped about 18% from their highs
-- Prices are clearly below the lower trend line of the upward sloping channel the average started in 2004

On the three month chart, notice the following:
-- Prices are below the 200 day SMa
-- All the SMAs are moving lower
-- Prices are below all the SMAs
-- The shorter SMAs are below the longer SMAs
This is the most bearish simple moving average orientation a chart can have.
The NASDAQ 100 or QQQQs
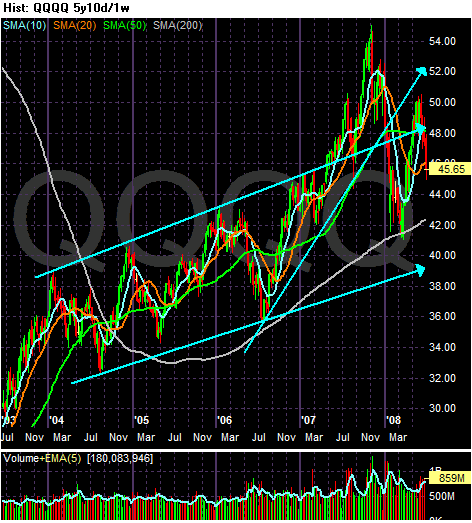
There are two important trends with the QQQQs. The first is an upward sloping channel that started at the beginning of 2004. This trend channel is still intact. The second trend started in mid-2006 and constituted an upward sloping rally from mid-2006 to the beginning of 2008 when the QQQQs fell through this trend line. So, the long-term upward sloping trend remains intact, but the shorter rally is clearly over.
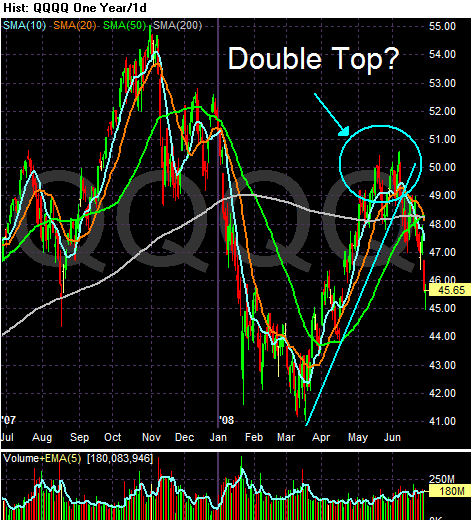
On the one year QQQQ chart, notice three things:
-- The rally that started in mid-March of this year is over, and
-- Prices are below the 200 day SMA
-- Giving the chart a very conservative eyeballing, it's down 16.62% from its late October, early November highs
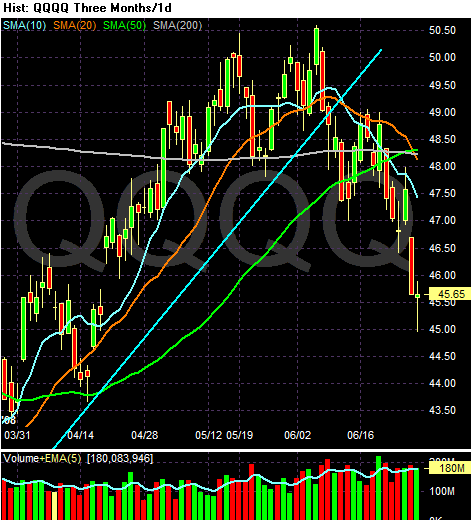
On the three month chart, notice the following:
-- Prices are below the 200 day SMA
-- Prices are below all the SMAs
-- The 10 and 20 day SMA are headed lower
-- The 10 and 20 day SMA has crossed below the 50 and 200 day SMA
This chart is not entirely bearish year. The longer-term averages (50 and 200 day SMAs) are still bullish. However, with prices and the shorter SMAs below these numbers that won't last for much longer.
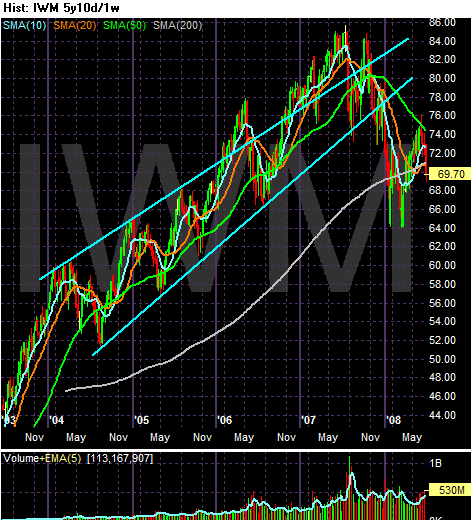
On the IWMs 5-year weekly chart, notice the average was in a clear upward sloping channel until late 2007/early 2008 when the average broke through the lower trend line. Since then the average has fallen to the 200 week SMA and has fallen through that important trend line twice. The IWMs formed a double bottom in early 2008 and rallied after the second bottom. The IWMs moved into the 50 week SMA but fell from that SMA and are now through the 200 week SMA again.
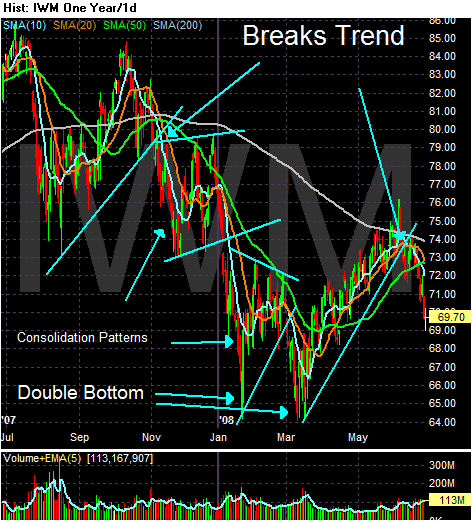
On the yearly chart, notice the IWMs were in a clear downward sloping trend from teh end of September to the beginning of March. They index continually moved lower forming consolidation patterns along the way down. This chart also clearly shows the double bottom and the ensuing rally. From the highs of last summer to the current price, the index has dropped about 18%.
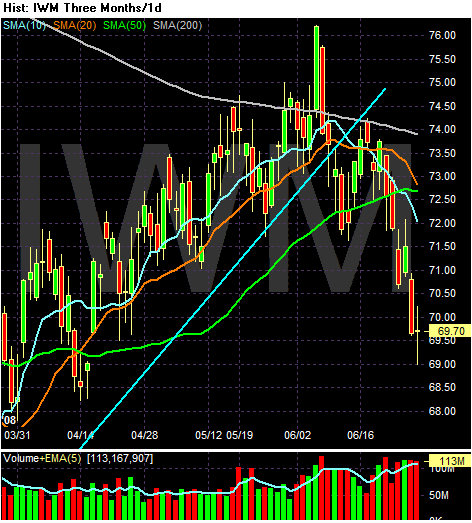
On the three month chart, notice the following:
-- Prices broke through the 200 day SMA but couldn't maintain momentum
-- Prices are now below all the SMAs
-- The shorter SMAs are below the longer SMas
-- The 10 and 20 day SMA are both headed lower
-- The 10 day SMA broke through the 50 day SMA and the 20 day SMA is about to cross below the 50 day SMA
In other words, this chart is moving into a very bearish orientation.
So far we have the following:
-- The SPYs and the IWMs are in a very bearish formation
-- The QQQQs are in a neutral bearish formation.
Let's look at the fundamental picture.
The Fed
In their last policy statement, the Fed signaled they are done lowering rates:
The substantial easing of monetary policy to date, combined with ongoing measures to foster market liquidity, should help to promote moderate growth over time. Although downside risks to growth remain, they appear to have diminished somewhat, and the upside risks to inflation and inflation expectations have increased. The Committee will continue to monitor economic and financial developments and will act as needed to promote sustainable economic growth and price stability.
In addition, after adjusting for inflation interest rates are already negative, so there isn't much point in cutting rates further.
Upward Moving Commodity Pricing Pressures
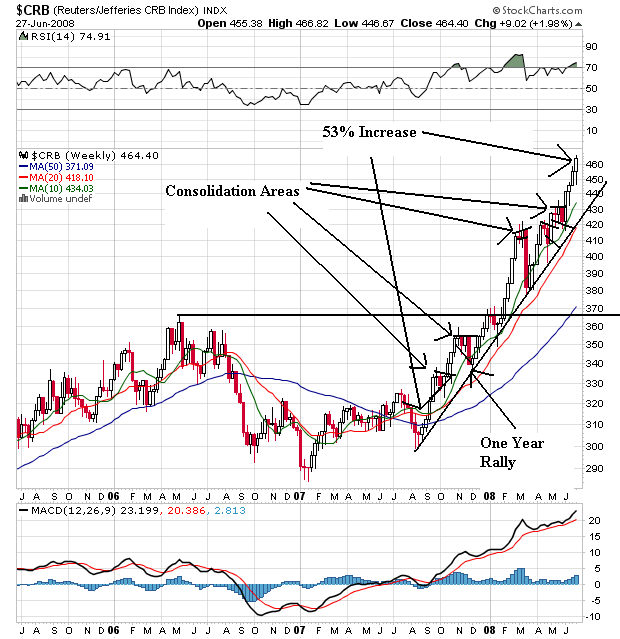
The CRB index is up 53% since August of last year. It is in a clear rally. Notice that as prices have increased they have taken the time to consolidate gains before moving higher. Also notice the following:
-- All the SMAs are moving higher
-- The shorter SMAs are above the longer SMAs
-- Price are above all the SMAs
This is a very bullish chart
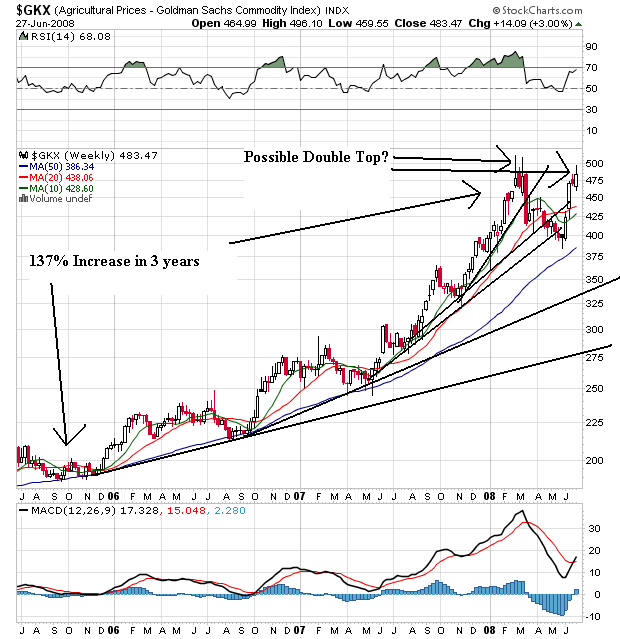
Agricultural prices have been in a three year rally, although they started to correct from this rally earlier this year and broke through key upward sloping support. However, the situation in the US mid-west gave agricultural prices a bid and they have since moved higher. But also note they could be forming a double top here. Also notice the following:
-- Prices are above all the SMAs
-- All the SMAs are moving higher
-- The 10 week SMA moved below the 20 week SMA, altghough the 10 week SMA is still moving higher
This is also a very bullish chart, although we'll have to wait and see how the possible double top plays out.
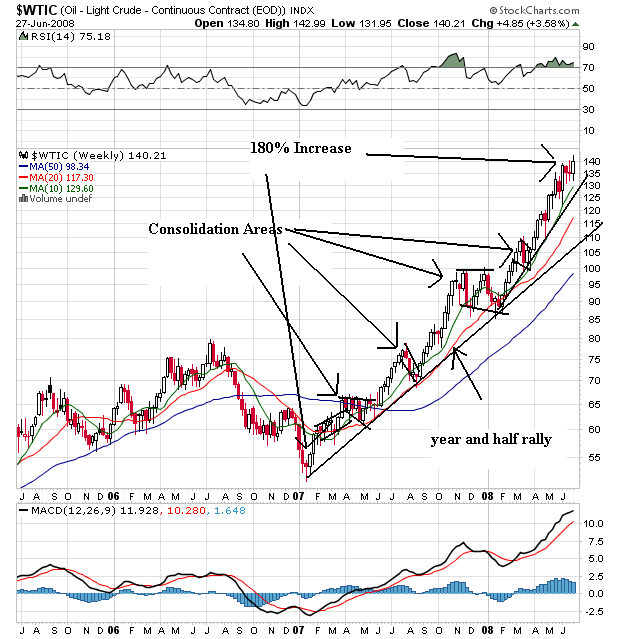
Oil is the 800 pound gorilla in the room. This chart is incredibly bullish. First, notice that for the last year oil has continually moved higher. As it has moved higher it has consolidated gains and then made hew highs. Also notice the following:
-- Prices are above all the SMAs
-- The shorter SMAs are above the longer SMAs
-- All the SMAs are moving higher
This chart is about as bullish as you can get.
So, we have spiking commodity prices hemming in the Fed and consumer spending. In addition, the "stimulus" package is about over; we've got maybe another 2-3 months of mileage from that move. In other words, the possible policy responses from Washington are gone.
A Consumer Under Pressure
Add to all this a deteriorating picture for the consumer. Consider the following charts from econoday:
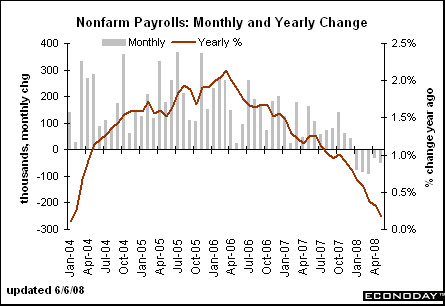
Job growth is slowing, leading to
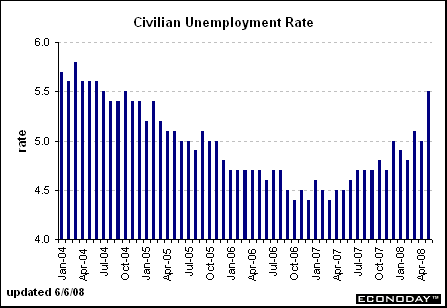
Increasing unemployment which is
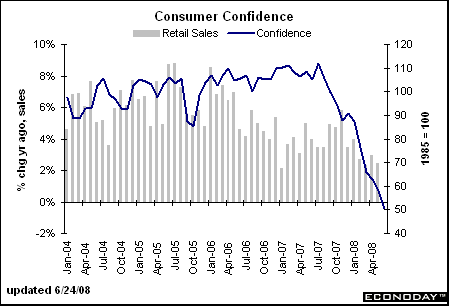
Lowering consumer confidence and
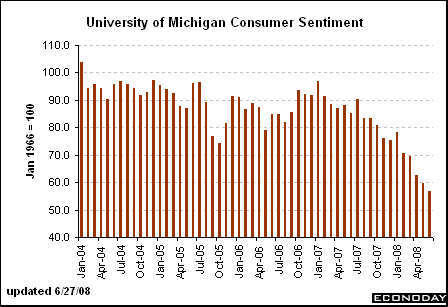
Consumer sentiment
Let's sum up:
-- Two of the three major averages are in a very bearish orientation while a third is in neutral to bearish territory
-- The Federal Reserve has indicated they are done lowering rates.
-- Higher commodity prices makes further rate cuts highly unlikely and is also hemming in consumer spending
-- The stimulus package from Washington has nearly run its course
-- The job market is weakening which is increasing unemployment and lowering consumer sentiment and confidence.
In other words, there are very few reason to be optimistic right now.
And I will add there are several points I have not gone into:
-- Housing is nowhere near a bottom because of the massive supply/demand imbalance
-- The financial sector is still reeling from writedowns
-- The dollar is still dropping
In other words -- there are plenty of negative points I have not made for reasons of brevity, none of which bode well for the future.