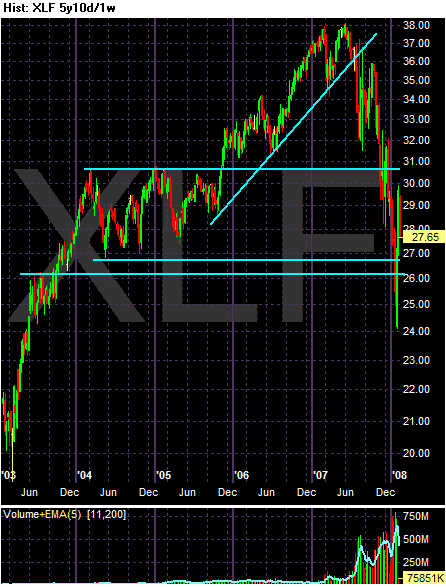
Above is a five year weekly chart. Notice:
-- The index formed a double top in early 2007.
-- The index broke a 1 1/2 year upward sloping trend in mid-2007
-- The index has broken through support levels established in 2004.
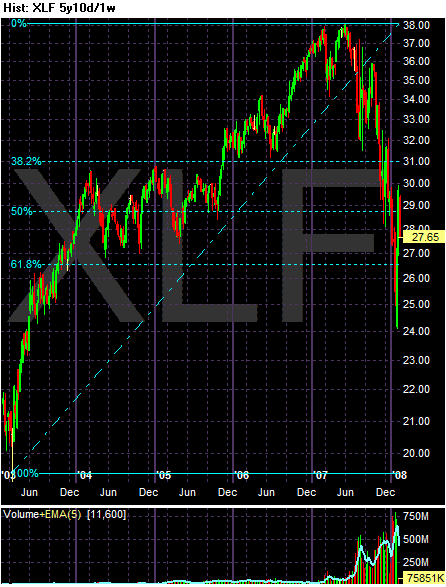
Above is a chart of Fibonacci levels on the 5 year chart. Notice the prices are currently at levels where traders would expect a reversal -- at at least for "something" to happen.
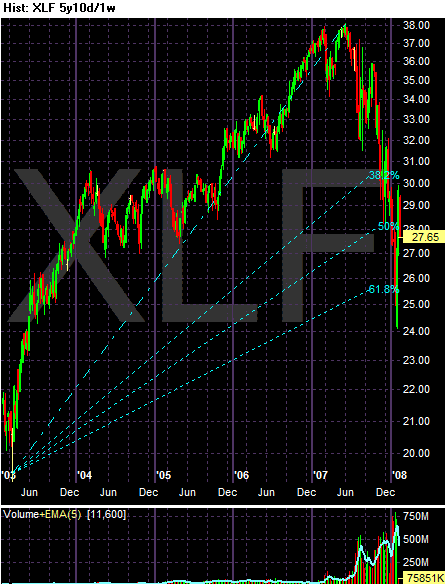
Above is a 5-year chart with Fibonacci fan levels, again indicating prices are currently at reversal points -- or at least at levels where "something" would happen.
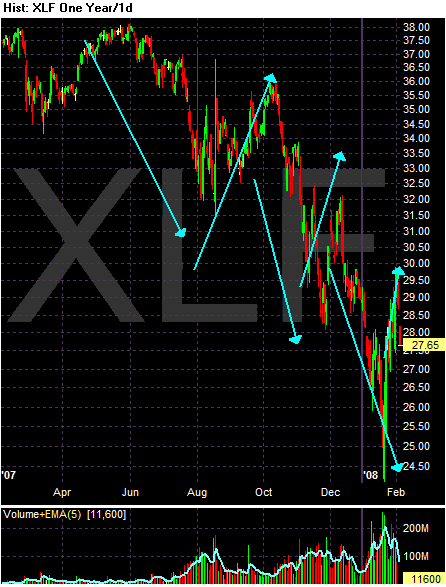
We've already established the financial sector is in the middle of a really strong sell-off. Above is a 1-year chart that shows the index is clearly in the middle of a down, up, down bear market pattern, and that the index is making lower lows and lower highs. This is not a good looking chart.
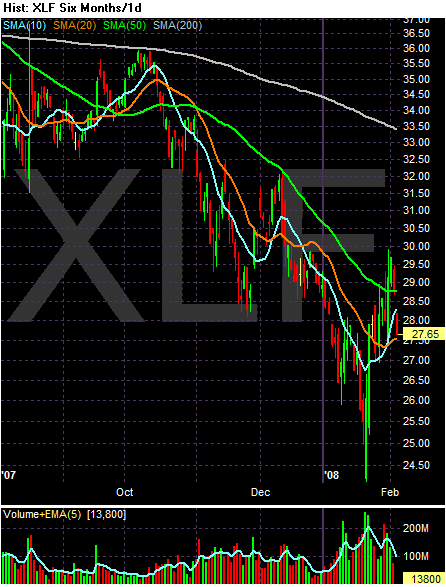
Above is a chart of the SMAs. These are interesting. Notice the following:
-- Prices are still below the 200 day SMA by a wide margin.
Let's look at a shorter time chart:
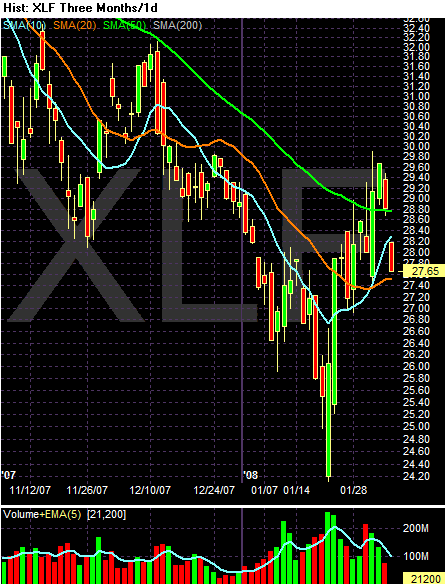
Notice:
-- the 10 day SMA has crossed over the 20 day SMA and is still moving higher
-- the 20 day SMA is pointing higher
-- the 50 day SMA is leveling off
-- Prices are between the SMAs
-- Notice the 10 day SMA crossed over the 20 day SMA in late November. But that was not accompanied by a leveling off of the 50 day SMA.
This chart indicates the financial sector may be bottoming in the short term. It is still too early to make a firm prediction one way or the other. But the SMAs indicate we are are least thinking about having a rally in the financials right now.
I should add that fundamentally, I am still very bearish on this sector. The news has not been good from at least 6 months, and I don't expect it to change anytime soon. In addition, I think we have a ton of writedowns still in the works. Bottom line -- the fundamentals are terrible. A rebound would be a technical, "these things look cheap" move, not one driven by a fundamental "business is getting better" sentiment.