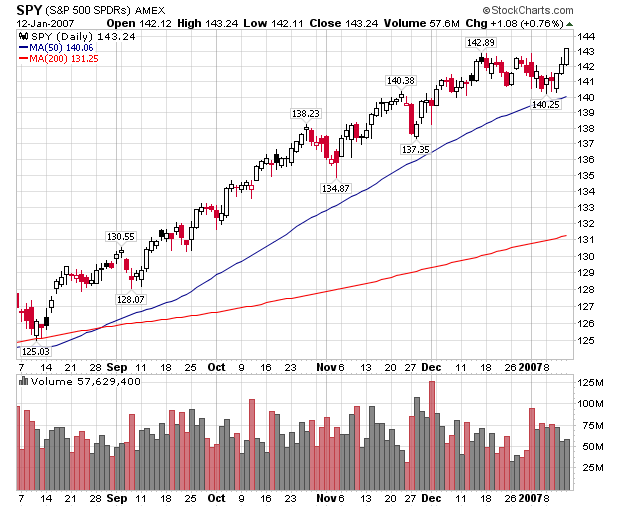
The SPYs closed at $143.24, a touch higher than the $142.89 from mid-December. However, notice the lower volume total for Friday's close. New highs should be accompanied by increasing and/or high volume to indicate excitement. The lack of rising or strong volume makes the rally a bit suspect. The lack of high volume is not fatal, however. It's just something to keep our eyes on.
Here's a chart of the QQQQs:
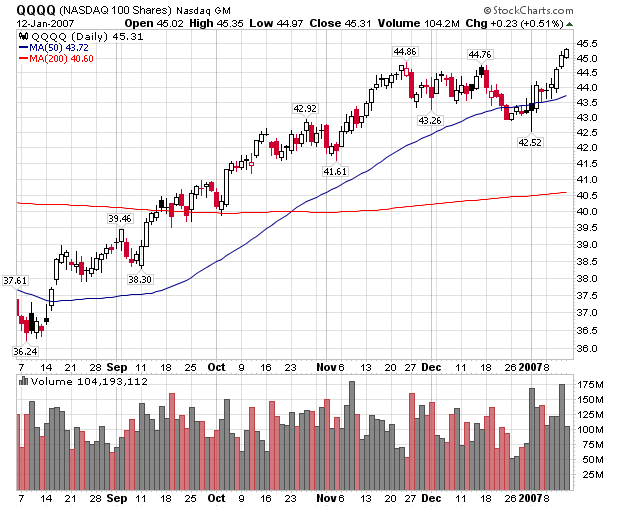
Last week the QQQQs had a good rally with decent volume. Friday's close was above the highs of mid-December. This chart gives us some good upward momentum for the coming week.
Here's a chart for the Russell 2000 (IWM)
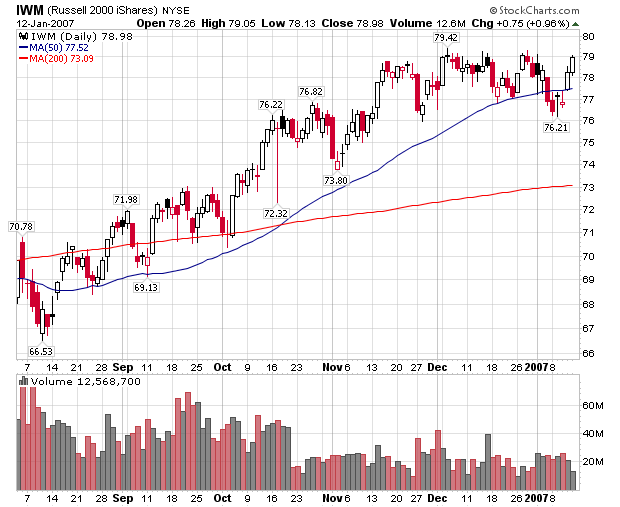
This is not a good chart for future upward moves. Last week's rally didn't break any new levels and occurred on decreasing volume. In other words, traders were less excited about this particular market index. Increasing prices on decreasing volume has all of the hallmarks of a reaction rally, implying the IWMs may be moving lower.
So, we have the QQQQs in a good technical position for the coming week -- rising prices with good volume. The SPYs are a bit suspect because of the lack of volume, but it's not fatal. The IWMs would need strong upward movement with better volume to break-out.
And here's my usual caveat: technical analysis isn't a science. The market's will do everything they can to humble you at every turn.