Friday, July 14, 2023

The American working class is doing better, thank you very much


 - by New Deal democrat

With the release of the CPI report earlier this week, I can update several measures of average middle class American income.


Real average hourly wages increased 0.2% in June, and are up 1.6% from one year ago:


Real aggregate payrolls for the entire spectrum of nonsupervisory American workers increased  0.3% in June and are up 3.1% from one year ago:


This is an excellent coincident marker of an expanding economy vs. recession. It tells us that, mainly thanks to declining gas price since June 2022, average American workers and their households have had a significant increase in their ability to buy things. A very good positive sign.

Finally, one last note about various measures of inflation. A few commentators highlighted the still-high +5.9% YoY increase in “sticking price” inflation. But as shown below, the 1 month and 3 month average changes in even that metric have declined sharply, to close to the Fed’s target range:


By any reasonable measure, inflation is no longer a major problem.

Thursday, July 13, 2023

Initial claims move closer to red flag recession warning


 - by New Deal democrat


Initial jobless claims declined -12,000 last week to 237,000. The four week average declined -6,750 to 246,750. With a one week delay, continuing claims increased 11,000 to 1,729,000:


More importantly for forecasting purposes, the YoY% increases were 7.2% for the weekly number, 14.5% for the 4 week average, and 31.6% for continuing claims respectively:


This is the 4th week in a row that the 4 week average has been higher YoY by more than 12.5%. If this continues for several more weeks, that would be sufficient to trigger a red flag recession warning from this series.

Finally, since initial claims have a long-established history of leading the unemployment rate, here is the comparison of YoY claims averaged monthly (blue) as well as the 4 week average, compared with the YoY% change in the unemployment rate (gold):


Note importantly that the graph above measures the change in the unemployment rate as a “percent of a percent,” so for example a 10% increase from 3.6% would be just below 4.0%. To trigger the Sahm rule, we would need a 0.5% increase in the actual rate from the 3 month average of the lowest unemployment rate in the past year. To put it plainly: for forecasting purposes, we’re not there yet. But since the Sahm rule tells us retroactively when we have started a recession, it doesn’t affect my own forecasting analysis.

Wednesday, July 12, 2023

June inflation almost non-existent except for the fictitious measures of shelter


 - by New Deal democrat


 The message of this morning’s consumer inflation report was the same for almost everything except for the fictitious measures of shelter: sharp deceleration everywhere.


Let’s take a look:

Headline CPI up 0.2% m/m and 3.1% YoY (lowest since March 2021)
Core CPI up 0.2% m/m and 4.9% YoY (lowest since October 2021):


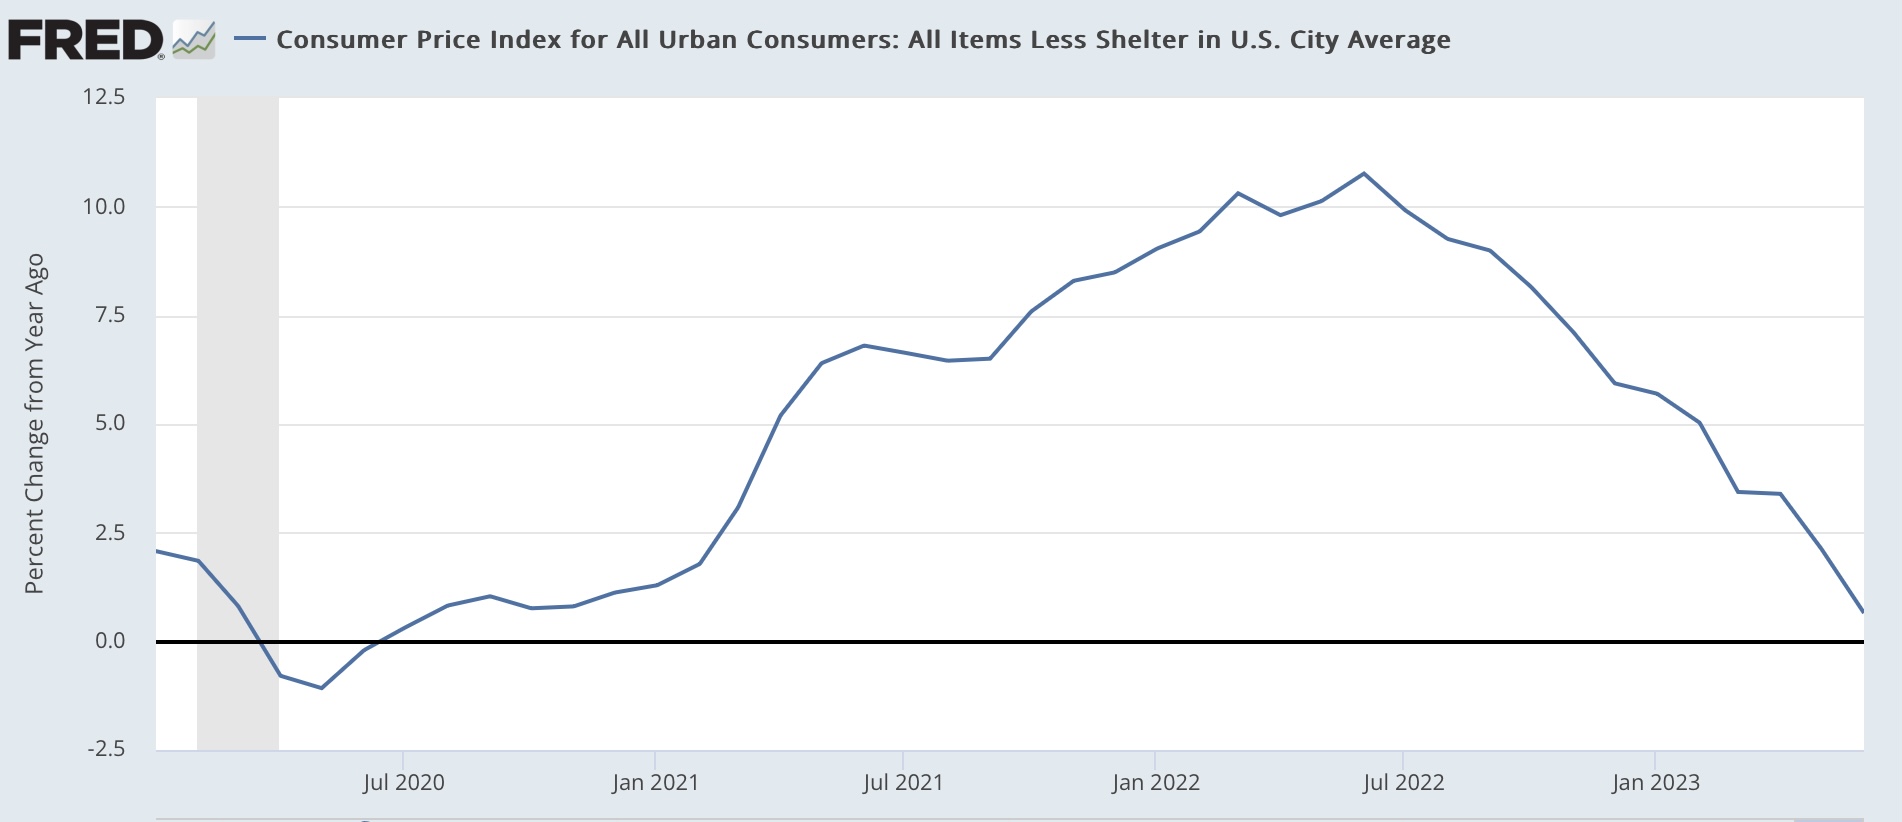
CPI less shelter up +0.2% and 0.7% YoY (lowest since February 2021):


New and Used vehicles: 0.0% and down -0.5% respectively m/m, and up +4.1% and down -5.2% YoY respectively:


Food up 0.1% m/m and 5.7% YoY:


But food is only up 0.3% in the 4 months since February:


Transportation services (replacement parts, repairs etc.) has also been a hot spot, and has also decelerated, up 0.4% m/m and up 8.2% YoY (but down from a peak of 15.2% YoY last October:


Finally, Owners Equivalent Rent up 0.4% m/m:


and 7.8% YoY (down from all time YoY high of 8.1% YoY in April):


Here’s what it looks like in comparison with house prices as measured by the Case Shiller national index YoY (/2.5 for scale):


Since the beginning of this year, monthly increases in OER have declined from 0.8% to 0.45%. YoY OER is probably going to be below 4.0% and maybe below 3.0% by the end of next winter.

To sum up: except for the fictitious measure of shelter, the only other remaining “hot spots” for inflation are new vehicles (but resolving as the supply chain issues have finally resolved) and transportation services. Food inflation has basically stopped in the past 4 months. 

And if actual new rent increase and house prices were substituted for the fictitious OER measure and the 12 month average used for leases, headline inflatioin would only be up about 0.8% YoY, and core inflation up 3.0%.

But I’m sure there’s some sticky price blah blah blah somewhere that will justify the Fed’s continued hawkishness.


Tuesday, July 11, 2023

Scenes from the employment report: important leading and coincident indicators of recession


 - by New Deal democrat


Here’s another detailed look at some significant data from last Friday’s employment report.  In this post I’ll look at some leading and coincident indicators.


First, about the unemployment rate. This is a lagging indicator coming out of recessions, but a leading one on the way in. While it is interesting that it declined -0.1% for the month, for forecasting purposes the YoY change is more important.

Here’s another look at the “jobless claims lead the unemployment rate” metric. The below graphs measure the YoY% change in jobless claims, averaged monthly, /10 for scale (blue). The red line is the change in the unemployment rate YoY, from which I subtract -0.1% for reasons I’ll explain after these first two graphs:


What these show is that, going back 50+ years, initial claims always turn higher YoY first, while the unemployment rate turns higher by +0.2% or more within 6 months before to 2 months after the the onset of recessions. There are only two exceptions: one month in 1985, and the near “double-dip” of 2002.

Here is the same graph for the past 24 months:


The unemployment rate was +0.1% higher YoY in May, and unchanged YoY in June. This is close to but not yet signalling the onset of a recession. But if jobless claims remain as elevated YoY in July and August as they were in June, that would almost certainly indicate that the unemployment rate trigger is shortly to follow.

Next, let’s take a look at two leading job sectors that haven’t quite turned yet, because of supply logjams in the Fed’s interest rate transmission mechanism.

Motor vehicle production had severe supply constraints all the way into 2022. As a result (not shown), only in the first half of this year did sales routinely meet or exceed 15 million on an annualized basis.

As a result, employment in vehicle manufacturing (blue in the graph below) has continued to increase sharply. Normally manufacturing employment (red) turns down well before a recession begins. But while it has flattened, it has not turned down:


As shown above, vehicle manufacturing employment is about 5-8% of all manufacturing employment.

This next graph below compares total manufacturing employment, with manufacturing employment excluding motor vehicles (blue):


Ex-motor vehicles, manufacturing employment has indeed turned down since the beginning of this year.

There’s a similar situation in housing construction. The first graph below compares housing units under construction (red) with residential construction employment (blue). Unsurprisingly the former leads the latter:


Since housing under construction is only down slightly from peak, residential construction employment has barely turned down at all.

Finally, let’s update one of my big coincident indicators of recession, the YoY% change in real aggregate payrolls. Below I’ve divided it into nominal payrolls (blue) vs. CPI (red), which hasn’t been reported yet for June:


You can see that, going back 50+ years, whenever YoY inflation exceeds YoY nominal payroll growth, a recession is just beginning.

Here’s the same graph since the onset of the pandemic:


Nominal payroll growth, while decelerating, has done slightly more slowly than inflation, meaning that real aggregate payrolls have continued to increase. Meaning more buying power for average Americans. 

An important issue is whether, with YoY comparisons now including gas prices that were declining from $5 (meaning they are less positive), the serendipitous comparison between payrolls and inflation will continue. And a big part of that issue is also, now that the supply bottlenecks in vehicle production and housing have abated, those two sectors of employment will finally roll over.

Monday, July 10, 2023

Scenes from the June employment report: consumption leads employment, goods vs. services edition


 - by New Deal democrat


No big new economic news today, so let’s take a more in-depth look at some of the information from Friday’s employment report. Today I’m going to focus on the division between goods and services.


As I’ve written many times in the past, consumption leads employment. Typically I have shown that via real retail sales. The variation I am going to use today is employing real personal spending on goods vs. services, and how consumption leads employment for each.

As a refresher, here is real personal spending on goods YoY (blue) vs. services (red), up until the pandemic:


Note that spending on goods is much more volatile than spending on services (in fact I’ve divided the result for goods by 1.5 so that services spending doesn’t just show up as squiggles). Most importantly, it tuns down YoY generally coincidently with the onset of recessions, whereas growth in services spending usually just decelerates. Also, while the two moved coincidently from 1960-90, since then spending on goods has usually led spending on services somewhat.

Here’s the same information since the pandemic (omitting the year of huge distortions):


Goods spending did fall below zero during much of 2022, and is only slightly above zero YoY now, while spending on services is much stronger.

Now let’s compare real spending on goods (blue) with employment in the goods sector (red) YoY, pre-pandemic:


With two exceptions (the mid 1980’s and late 1990’s) goods consumption leads goods employment. Note that this holds true even though due to globalization and offshoring, goods employment never rose nearly as much as goods consumption beginning with the 1980’s.

The same leading/lagging relationship holds true for consumption of services (blue) vs. employment in services (red):


Now let’s look at each post-pandemic. First, here is goods consumption vs. employment:


Goods spending recently peaked YoY in summer 2021, while as we should expect based on past history, goods employment did not peak until spring 2022. Goods spending rebounded somewhat as spending power increased with the decline in gas prices from $5 to $3/gallon in late 2022. Goods employment is still decelerating, and is only up 0.3% since February, or roughly at a 1% annual rate.

Here is services consumption vs. employment:


Both consumption and employment in the services sector have been much stronger than in the goods sector, and while both have been decelerating since the spring 2021 stimulus spree, consumption has decelerated faster compared with late 2021.

Since gas prices have been pretty stable this year, the tailwind for goods spending is subsiding. I expect goods spending to decelerate further YoY, and probably turn negative again, with goods employment following. My best guess is this will occur by the end of this year, possibly earlier.

As per past history, the deceleration in both consumption and employment in the goods sector is likely to be slower, but will follow goods spending and employment with lower growth if not an outright decline.


Saturday, July 8, 2023

Weekly Indicators for July 3 - 7 at Seeking Alpha


 - by New Deal democrat


My Weekly Indicators post is up at Seeking Alpha.

A real-time daily update of inflation (based on millions of prices posted at internet sales sites among other things) has become available, and has been added to the array of coincident indicators.

The complete array remains consistent with very slow growth that has not tipped over into contraction. But despite the pent-up demand for vehicles and housing, which has stretched out this slowdown phase considerably, the best available leading indicators continue to point downward.

As usual, clicking over and reading will bring you up to the virtual moment, and reward me a little bit for my efforts.

Friday, July 7, 2023

June jobs report: deceleration conitinues, with weakest private jobs sector growth since 2020


 - by New Deal democrat


My focus remains on whether jobs growth continues to decelerate, and whether the leading indicators, particularly manufacturing and construction jobs, as well as the unemployment rate (which leads going into recessions) have meaningfully deteriorated.

In May the headlines on employment were decent if slightly weak, but hid much more weakness, while unemployment improved, but not for the best of reasons.

Here’s my in depth synopsis.


HEADLINES:
  • 209,000 jobs added, the weakest monthly number since December 2020.
  • Private sector jobs increased only 149,000. Even worse, Education and health hiring was 73,000 of that total (UPDATE: 65,200 in health, 7,200 in education. An earlier version erroneously indicated all education); all remaining private categories added only 76,000. Government jobs increased by 60,000. 
  • April was revised lower by -77,000 and May by -33,000, for a total of -110,000. The three month moving average decreased to 244,000.
  • The alternate, and more volatile measure in the household report rose by 273,000 jobs. The YoY% gain in this report is +1.9%, an increase from May but near its lowest rate since 2020.
  • The U3 unemployment rate declined -0.1% to 3.6% (still above the 3.4% low last year). The civilian labor force, the denominator in the figure, rose slightly (by 183,00), while the numerator, the number of unemployed, declined by -140,000.
  • U6 underemployment rate rose 0.2% to 6.9%
  • Further out on the spectrum, those who are not in the labor force but want a job now declilned -88,000 to 5.389 million, still well above its post-pandemic low..

Leading employment indicators of a slowdown or recession

These are leading sectors for the economy overall, and help us gauge how much the post-pandemic employment boom is shading towards a downturn.  These were mainly positive:
  • the average manufacturing workweek, one of the 10 components of the Index of Leading Indicators, was unchanged at 40.7, still down -0.9 hours from February peak last year of 41.6 hours.
  • Manufacturing jobs increased by 7,000.
  • Construction jobs increased by 23,000.
  • Residential construction jobs, which are even more leading, rose by 800. It nevertheless appears likely that January was the peak for this sector.
  • Goods jobs as a whole rose 29,000. These should decline before any recession occurs.
  • Temporary jobs, which have generally been declining late last year, declined sharply, by -12,600.
  • the number of people unemployed for 5 weeks or less declined -15,000 to 2,068,000.

Wages of non-managerial workers
  • Average Hourly Earnings for Production and Nonsupervisory Personnel increased $.13, or +0.3%, to $28.75, a YoY gain of 4.7%, the lowest YoY gain since June of 2021.

Aggregate hours and wages: 
  • the index of aggregate hours worked for non-managerial workers increased 0.2%.
  •  the index of aggregate payrolls for non-managerial workers rose 0.5%, and increased 6.2% YoY, the lowest rate since March 2021, but significantly above the inflation rate, meaning average working class families have more buying power.

Other significant data:
  • Leisure and hospitality jobs, which were the most hard-hit during the pandemic, rose only 21,000, -328,000, or -2.0% below their pre-pandemic peak.
  • Within the leisure and hospitality sector, food and drink establishments, declined for the first time since 2020, down -800 jobs, and remain-52,100, or -0.4% below their pre-pandemic peak. 
  • Professional and business employment rose only 21,000. This series has also been decelerating and is now up  2.1% YoY.
  • The Labor Force Participation Rate was unchanged at 62.6%, vs. 63.4% in February 2020.
  • The number of job holders who were part time for economic reasons rose a sharp 452,000.


SUMMARY

The headline for this report would be the typical “deceleration continues, but objectively strong” if it were not for the anemic private jobs growth. Only 76,000 private jobs were added, ex-education and health. Professional and business job growth declined to its lowest level in 3 years except for 2 months. Restaurant and bar employment actually declined, ending its strong comeback.

Further, while the unemployment rate declined slightly, this was in part due to a lackluster increase in the civilian labor force. And the underemployment rate increased to its highest level in almost a year, due in large part to a sharp increase in involuntary part time employment.

On the plus side, the leading sectors of manufacturing, construction, and employment in the goods producing sector as a whole all increased. I do not think there is going to be a recession until this sector definitively rolls over.

Thursday, July 6, 2023

May JOLTS report: continued decelerating trend, but still extremely positive


 - by New Deal democrat


Let me start out with the statement that has been my touchstone for the JOLTS report for the last year or more: for the last several years, the jobs market has been a game of “reverse musical chairs,” where there are always more chairs than participants. Those employers whose chairs weren’t filled had to increase their wage and/or benefits offerings, or go without. This was good for labor, but certainly put pressure on prices as well. Because the jobs market has remained so strong, it has been unlikely that a recession would start unless the situation with job openings returned to at least close to its pre-pandemic levels. Only then could there be enough layoffs to actually be consistent with a negative monthly jobs number.


This morning’s report for May was more of the same: the decelerating trend remained intact, but there was some month over month strength. And there hasn’t been enough of a return to pre-pandemic “normalcy” to make me think we are anywhere close to an actual negative monthly jobs print.

To the numbers: Job openings declined -496,000 to 9.824 million. This is less than 1/2 of the decline from the post-pandemic peak of 12.200 million vs. the pre-pandemic peak of 7.600 million. Hires rose 107,000 to 6.208 million, still significantly above their pre-pandemic record. And Quits rose 250,000 to 4.015 million, also well above their pre-pandemic level, but also well below their post-pandemic peak:


Here is the long-term pre-pandemic history of all three metrics for comparison:


Just to emphasize again: note the current numbers are all trending down from their post-pandemic peaks, but not close to their pre-pandemic averages or even peaks.

Meanwhile layoffs and discharges were virtually unchanged from April, at 1.585 million:


Here is their pre-pandemic history as well, showing that they are well below those levels (a positive):


Last month I wrote that “there are two overarching trends in this data:

(1) the absolute fundamentals for labor remain quite positive,
(2) but they continue to decelerate.”

That remained the case with this month’s report. While I am anticipating that the unemployment rate is likely in rise slightly in the next few months, I don’t think we are anywhere near having an actual negative jobs print.

Initial jobless claims: moving closer to a red flag warning


 - by New Deal democrat

Initial claims for jobless benefits rose 12,000 last week to 248,000. The 4 week average declined -3,500 to 253,250. With a one week lag, continued claims declined -13,000 to 1.20 million:


More importantly for forecasting purposes, initial claims are up 17.1% YoY. The more important 4 week average is up 18.1%, and continuing claims are up 27.0%:


This is the 4th week in a row that the 4 week moving average has been up by more than 12.5% YoY. 

Additionally, averaged monthly initial claims were up 18.5% for the month of June in its entirety:


This is the first month that claims have been higher YoY by more than 12.5%. If they remain higher than 12.5% for July, that will trigger a red flag recession warning. In the above graph I have also shown the YoY% change in the unemployment rate. This is a “percent of a percent.” The unemployment rate was 3.6% in June 2022. Since initial claims leads the unemployment rate, this suggests that it will rise 0.36% (or possibly more) above that rate in the coming months, or up to about 3.9%. This would not yet trigger the “Sahm Rule,” with retroactively tells us we are already in a recession, but it would be much closer.

Wednesday, July 5, 2023

MIdyear update: the state of the big monthly coincident indicators


 - by New Deal democrat


Let’s take a look at the important monthly coincident indicators that the NBER has indicated they weight most heavily, along with quarterly real GDP, in gauging whether the economy is expanding or contracting. Remember, a recession isn’t actually defined by 2 quarters of negative GDP, but rather by a significant decline in jobs, income, sales, and production.


Here is what all 5 monthly indicators look like, normed to 100 as of January, except for industrial production and real personal income less government transfers, which are normed to 100 as of their peaks last September:


Industrial production is still below its level of last September, and total real sales below their peak this past January. Real personal spending is only 0.1% higher than it was in January.

The only significant increases are to real personal income, up 0.3% since last September, almost all of it due to May; and nonfarm payrolls, which have continued to rise sharply.

And to some extent we should discount increases in real personal income and spending that are not significant. As the two below graphs show, both metrics continued to rise during the recessions of 1970. Real personal income also rose in 1970, and was flat in 1982. Real spending rose in 1960, 1970, and 1982, and 2001 as well:


In other words, about half the time real income and spending were flat or even increased during the recessions of the past 60 years.

Subject as always to revisions, with the exception of nonfarm payrolls, which obviously remain very positive, the economy was a lot closer to recession during the first half of this year than most observers acknowledge.

Coronavirus update: mid year 2023


 - by New Deal democrat


I haven’t done an update on the state of COVID since March or April. As we are halfway through the year, and just past the July 4 holiday get-togethers that sparked summer waves in the past, let’s take a look. Covid isn’t gone, but it is very much in a lull.


Almost all case tracking by governments is gone. But Biobot’s wastewater monitoring, which has been very reliable, continues. And it shows that COVID particles per milliliter in wastewater is down to levels only previously seen in April through mid-July 2021, and March 2022 (the data in 2020 is sparse, so I am discounting that):


There has been an uptick since June 21, but nothing significant yet.

Hospitalizations as of the last week reported, June 28, were just below 6300, or only 900 per day, an all time low:


Similarly, deaths for the week of June 3, the most recent week for which death reports have been fully updated, were just below 630, or only 90 per day, also an all time low:


Although I don’t have a graph right now, the demographics of serious illness and deaths have continued to focus on the most elderly, and the unvaccinated. At this point anyone under age 50 who is fully vaccinated has almost no risk.

The XBB variant and its progeny (including E.U.1.1. and F.E.1.1) continue to account for about 99% of all cases:


There is simply no sign of any new significantly different variant creating any kind of wave.

If we don’t see a significant rise in cases in the next 10 days, then we have successfully had our first July 4 since 2019 with no outbreak.

In summary: COVID isn’t gone, but right now it is pretty somnolent.

Tuesday, July 4, 2023

A brief essay for July 4, 2023


 - by New Deal democrat


Selections from Brutus, the anti-federalist who argued against the Constitution’s institution of the Supreme Court:


“When great and extraordinary powers are vested in any man, or body of men, which in their exercise, may operate to the oppression of the people, it is of high importance that powerful checks should be formed to prevent the abuse of it.

“[T]hose who are to be vested with [the judicial power in the US Constitution], are to be placed in a situation altogether unprecedented in a free country. They are to be rendered totally independent, both of the people and the legislature, both with respect to their offices and salaries. No errors they may commit can be corrected by any power above them …

“[Indeed,] the judges under this constitution will control the legislature, for the supreme court are authorized in the last resort, to determine what is the extent of the powers of the Congress....

“[In] their decisions they will not confine themselves to any fixed or established rules, but will determine, according to what appears to them, the reason and spirit of the constitution.

“[T]hey will be interested in using this latitude of interpretation. Every body of men invested with office are tenacious of power; ... this of itself will operate strongly upon the courts to give such a meaning to the constitution in all cases where it can possibly be done, as will enlarge the sphere of their own authority. ....

“This power in the judicial, will enable them to mould the government, into almost any shape they please.”

Mark A. Lemley, “The Imperial Supreme Court,” Harvard Law Review, 2022:

Armed with a new, nearly bulletproof majority, conservative Justices on the Court have embarked on a radical restructuring of American law across a range of fields and disciplines. Unlike previous shifts in the Court, this one isn’t marked by debates over federal versus state power, or congressional versus judicial power, or judicial activism versus restraint. Nor is it marked by the triumph of one form of constitutional interpretation over another. On each of those axes, the Court’s recent opinions point in radically different directions. The Court has taken significant, simultaneous steps to restrict the power of Congress, the administrative state, the states, and the lower federal courts.…

“[T]he Court has begun to implement the policy preferences of its conservative majority in a new and troubling way: by simultaneously stripping power from every political entity except the Supreme Court itself. The Court of late gets its way, not by giving power to an entity whose political predilections are aligned with the Justices’ own, but by undercutting the ability of any entity to do something the Justices don’t like. We are in the era of the imperial Supreme Court.”

Selections from the Declaration of Independence:

“A[n authority] whose character is thus marked by every act which may define a Tyrant, is unfit to be the ruler of a free people.

“[A]ll men are created equal, that they are endowed by their Creator with certain unalienable Rights, that among these are Life, Liberty and the pursuit of Happiness.--That to secure these rights, Governments are instituted among Men, deriving their just powers from the consent of the governed, --That whenever any Form of Government becomes destructive of these ends, it is the Right of the People to alter or to abolish it, and to institute new Government, laying its foundation on such principles and organizing its powers in such form, as to them shall seem most likely to effect their Safety and Happiness.“

Monday, July 3, 2023

Manufacturing and construction sectors continue downward pull on economy


 - by New Deal democrat


As usual, we start the month with new manufacturing and construction data.


The ISM manufacturing index goes all the way back to the 1940s, and has been a very good short leading indicator of recession throughout that time (although nothing’s perfect!). However, since the “China shock” started 20 years ago, with so much offshoring of manufacturing, it has less weight both for the economy as a whole, and for the percentage of people employed in the sector. Thus it carries less weight now than it did before. In particular, several times in the past 10 years it has been at recessionary levels without any broad based turndown spreading beyond manufacturing.

So far, the same has been true this year. In June, the overall index declined another -0.9 to 46.0 (any score below 50 indicating contraction. The more leading new orders index improved, in the sense of getting less bad, rising from 42.6 to 45.6 - meaning continued contraction, but at a slower pace:


These continue to be plainly recessionary numbers for the manufacturing sector. 

The issue remains, how much will the weakness spread?

Some indication is given by this morning’s other report, for May: construction spending.

On a nominal basis, total spending rose 0.9% from April. The more leading residential construction spending rose 1.5% nominally for the month, but this was after steep downward revisions for earlier months:


But, the cost of construction materials rose 1.2% in May, meaning that inflation-adjusted total spending actually declined -0.3%, and real residential construction spending only rose 0.2%:


The bottom line is that both sectors continue to pull downward on the US economy, which is increasingly being buoyed by services spending, which is a coincident but not leading sector.