Saturday, January 8, 2022

Weekly Indicators for January 3 - 7 at Seeking Alpha


 - by New Deal democrat

My Weekly Indicators post is up at Seeking Alpha.

Surprisingly, Omicron has not had any wide impact on the coincident data - at least not yet.

On the other hand, the long leading forecast has become weaker, as interest rates have moved in the wrong direction.

As usual, clicking over and reading will bring you up to the virtual moment on where the economy is and where it is going, and will reward me a little bit for organizing that information for you.

Friday, January 7, 2022

December jobs report: more signs of real tightness, while new jobs added are (seasonally?) disappointing


 - by New Deal democrat

There were three big questions I had going into this jobs report: 
1. whether the big decrease in new jobless claims to a half century low would translate to another big top line number in the jobs report
2. is wage growth holding up? Is it accelerating?
3. Would last month’s “poor” 210,000 number of new jobs be revised higher? 

The answers were:
1. The 6 month average of monthly gains has declined significantly, from about 600,000 to 500,000 - still very good, but a significant deceleration in the past 2 months. We still have 3.6 million jobs to go to equal the number of employees in February 2020 just before the pandemic hit. At the current average rate for the past 6 months, that’s about 7 more months.
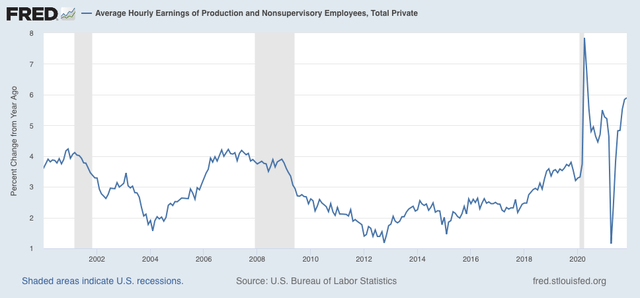
2. Wage growth is still very high, at 5.8% YoY, a slight deceleration from last month.
3. Both of the last 2 months were revised higher, but November’s revision was only +39,000, still disappointing.

Here’s my in depth synopsis of the report:

HEADLINES:
  • 199,000 jobs added. Private sector jobs increased 211,000. Government jobs declined by -12,000 jobs. The alternate, and more volatile measure in the household report indicated a gain of 671,000 jobs, the second very sharp increase in a row, and which factors into the unemployment and underemployment rates below.
  • The total number of employed is still -3,049,000, or -2,3% below its pre-pandemic peak.  At this rate jobs have grown in the past 6 months (which have averaged 508,000 per month), it will take another 7 months for employment to completely recover.
  • U3 unemployment rate declined -0.3% to 3.9%, compared with the January 2020 low of 3.5%.
  • U6 underemployment rate declined -0.4% to 7.3%, compared with the January 2020 low of 6.9%.
  • Those not in the labor force at all, but who want a job now, declined -106,000 to 5.713 million, compared with 5.010 million in February 2020.
  • Those on temporary layoff decreased -63,000 to 872,000.
  • Permanent job losers declined -206,000 to 1,703,000.
  • October was revised upward by 102,000, while November was revised upward by 39,000, for a net gain of 141,000 jobs compared with previous reports.
Leading employment indicators of a slowdown or recession

These are leading sectors for the economy overall, and will help us gauge how strong the rebound from the pandemic will be.  These were on balance positive:
  • the average manufacturing workweek, one of the 10 components of the Index of Leading Indicators, declined -0.1 hour to 40.3 hours.
  • Manufacturing jobs increased 26,000. Since the beginning of the pandemic, manufacturing has still lost -219,000 jobs, or -1.7% of the total.
  • Construction jobs increased 22,000. Since the beginning of the pandemic, -88,000 construction jobs have been lost, or -1.2% of the total.
  • Residential construction jobs, which are even more leading, rose by 700. Since the beginning of the pandemic, 46,600 jobs have been *gained* in this sector, or +5.5%.
  • temporary jobs declined by -1,600. Since the beginning of the pandemic, there have still been -57,100 jobs lost, or -5.3% of all temporary jobs.
  • the number of people unemployed for 5 weeks or less decreased by -8,000 to 1,977,000, which is lower than just before the pandemic hit.
  • Professional and business employment increased by 43,000, which is still -35,000, or about -0.2%, below its pre-pandemic peak.

Wages of non-managerial workers
  • Average Hourly Earnings for Production and Nonsupervisory Personnel: rose $0.12 to $26.61, which is a 5.8% YoY gain. This continues to be excellent news, considering that a huge number of low-wage workers have finally been recalled to work, and just below lat month’s high of +5.9% YoY.

Aggregate hours and wages:
  • the index of aggregate hours worked for non-managerial workers rose by 0.3%, which is a  loss of -1.5% since just before the pandemic.
  •  the index of aggregate payrolls for non-managerial workers rose by 1.1%, which is a gain of 9.4% (before inflation) since just before the pandemic.

Other significant data:
  • Leisure and hospitality jobs, which were the most hard-hit during the pandemic, gained 53,000 jobs, but are still -1,222,000, or -7.2% below their pre-pandemic peak.
  • Within the leisure and hospitality sector, food and drink establishments increased 43,000 jobs, and is still -653,000, or -5.3% below their pre-pandemic peak.
  • Full time jobs increased 803,000 in the household report.
  • Part time jobs decreased -275,000 in the household report.
  • The number of job holders who were part time for economic reasons decreased by -399,000 to 3,929,000, which is a decrease of 461,000 since before the pandemic began.
  • Health care employment declined by -3,100, a YoY gain of only 63,300, or 0.4%, despite being the most critical sector during the pandemic.

SUMMARY

Two days ago I described the November JOLTS report as being analogous to a reverse game of musical chairs, with jobs being the chairs and potential employees those wanting to sit in them. With a chronic shortage of people being willing to sit in the chairs on offer due to the pandemic, jobs are going unfilled, while virtually nobody is getting laid off. 

Today we learned that the dynamic continued in December, as the unemployment rate fell close to its 50 year lows, at a level only exceeded by one month in 2000, and during 2018-19. This also continued the dynamic of sharp wage increases for non managerial workers.

White collar professional jobs have almost fully recovered to pre-pandemic levels. Construction is not far behind. What are lagging are leisure and hospitality jobs most hard hit by pandemic issues, and - surprisingly - manufacturing. That health care is losing workers while the pandemic is at one of its worst levels is a demonstration of the failure of how the US has been dealing with the pandemic, as Trumpist courts and governors are refusing virtually all efforts at mitigation, and vaccinations are nowhere near the level needed for safety. The Biden Administration is not blameless, as its “vaccination-only” strategy has not worked.

It is also somewhat concerning that the last two months have only averaged a little over 200,000 jobs gained. But the household report, which tends to lead at inflection points, has been *very strong,* and October’s initial gain of 531,000 has since been revised up to 648,000. I suspect that seasonality has reared its ugly head, as the huge number of Christmas holiday jobs typically added has thrown a monkey wrench into pandemic calculations. If so, next month the report for this month (January) will reverse that.

All in all, the jobs sector continues strong, and is getting very tight, but still lagging in terms of filling job openings created by pandemic losses.

The final pieces of the employment picture will not resolve until the pandemic is resolved. 

Thursday, January 6, 2022

Initial and continuing jobless claims: 2022 starts out where 2021 left off


 - by New Deal democrat

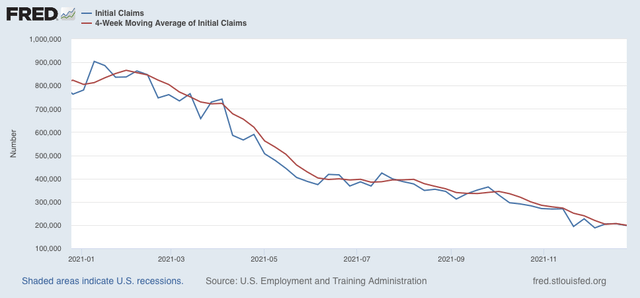
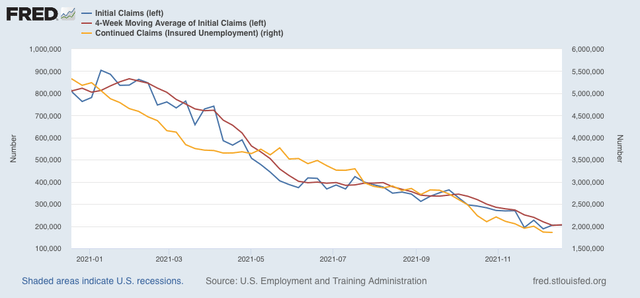
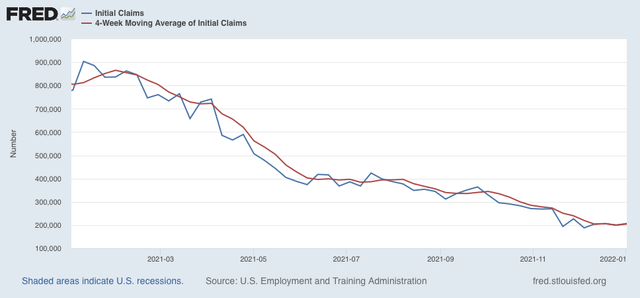
The labor market in 2022 started out where it left off in 2021, as new claims increased slightly, by 7,000, to 207,000. The 4 week average of new claims increased 4.750 to 204,500:


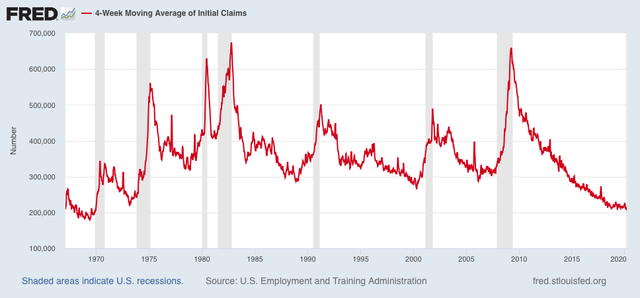
Readings this low haven’t been seen in half a century.

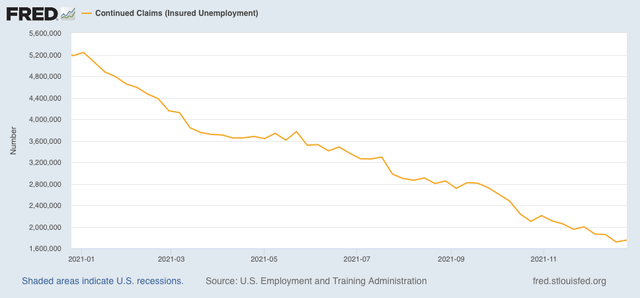
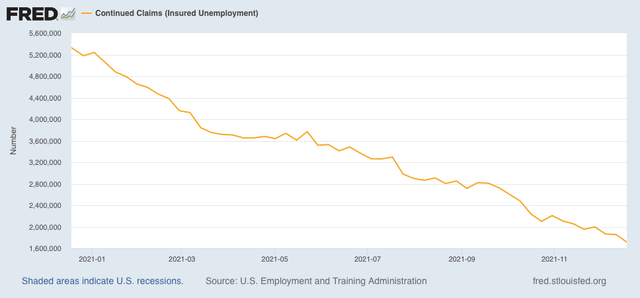
Continuing claims for jobless benefits also rose slightly, by 36,000, to 1,754,000:


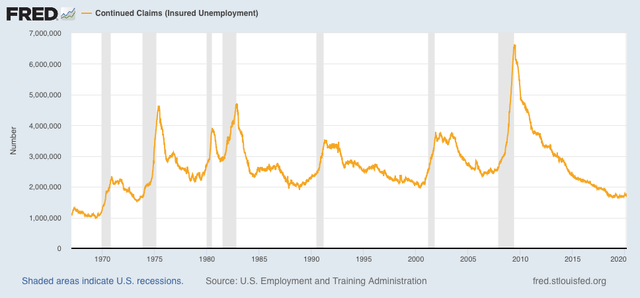
Except for 2018-19, we haven’t seen continuing claims this low since 1974:


We can expect this situation to continue so long as the pandemic keeps many potential workers (on the order of 4,000,000 or so) on the sidelines. As I wrote yesterday concerning the JOLTS report, it’s like a game of reverse musical chairs where the holders of the chairs can’t get enough people to sit in them. In those circumstances, virtually nobody is going to get laid off. I don’t know if initial claims will go any lower, but I suspect continuing claims will continue to decline to or even below their 2018-19 levels.

In the meantime, I expect another good employment report tomorrow, and I will be really surprised if last month’s initial estimate of a gain of 210,000 jobs in November isn’t raised substantially higher.

Wednesday, January 5, 2022

November JOLTS report: imagine, if you will, a game of musical chairs


 - by New Deal democrat

Imagine a game like musical chairs, except that some players are the chairs (employers) as well as people who want to sit in the chairs (potential employees), and players, both sitters and chairs, are continually entering and exiting the game.

The game would be in equilibrium if the number of sitters and chairs are always equal. If there are more sitters than chairs, sitters will be unsuccessful (unemployed). If there are more chairs than sitters, the chairs will be empty (unfilled job openings). In the former case, we would expect wages to go down (or at least increase more slowly vs. inflation); in the latter, we would expect wages to increase more sharply.

The JOLTS report for November, released yesterday morning, continued to show that there are far more chairs than there are those wanting to sit in them. As a result, wages have continued to increase sharply - even accelerate a little more.

To the details . . .

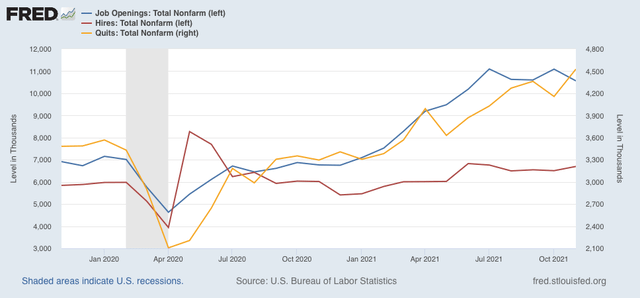
Job openings (blue in the graph below) decreased by -529,000 to 10.562 million, a little below the July peak of 11.098 million. Voluntary quits (the “great resignation,” gold, right scale) increased 370,000 to 4.527 million - a new record high. Actual hires (red) increased  191,000 to 6.697 million, in line with the past few months, and better than the early part of this year:


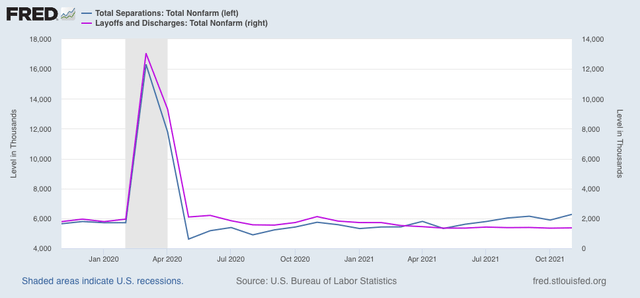
Layoffs and discharges (violet, right scale in the graph below) increased 19,000 from last month’s record low to 1.369 million. Total separations (blue) increased 382,000 to 6.273 million:


In summary, we continue to have near-record high job openings and low layoffs, new record high quits, with still-strong hiring and total separations; i.e., little progress is being made towards establishing a new equilibrium.

Further, as indicated in last month’s jobs report, wage gains YoY have continued to accelerate, up 5.9% in November, the highest since 1982 except for April and May 2020:


Returning to my rubric of musical chairs, due to the pandemic, there is a persistent shortfall - currently on the level of about 4 million - in the number of people willing to sit in the seats on offer from potential employers. They either are fearful of coming down sick, don’t want to face irate customers, or have to stay home to provide care to their children either due to lack of childcare options or closed schools.

Because of this persistent shortfall, those willing to sit in the chairs can “trade up” to a more desirable chair. As each potential sitter does so, the lowest 10% or so of chairs are consistently left vacant. To fill those chairs with bodies, employers have to offer more money. But so longs as the shortfall persists, there will always be rotating number of vacant chairs, and those potential employers with those empty chairs will have to continually offer more compensation to get people to sit in them.In other words, wages will continue to rise until the potential employer can no longer make any profit off the potential employee for that job.

Because the JOLTS data has only been around for 20 years, there are only two jobs recoveries with which to compare the present situation. 

In order for the situation to resolve, the first thing I want or expect to see is a further increase in monthly hiring. At the same time, or shortly thereafter, I would expect to see a significant decline in voluntary quits. Only after these two things have occurred would I expect to see a substantial downturn in job openings, and I would not expect to see any significant increase in layoffs until all of those other trends are in place.

In November, we didn’t get an *increased* surge in hiring, and far from declining, quits increased. In other words, we are nowhere near to resolving the current jobs market imbalance - the best situation for employees in half a century.
——
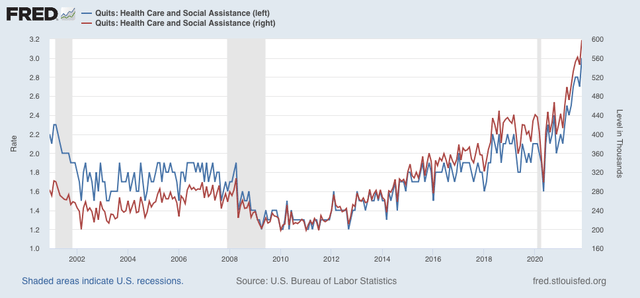
One postscript: I also want to make note of one specific jobs sector. Below is the quits rate (left scale) and number (right) for employees in the health care sector:


Both made new records, and are roughly 30% higher than at any time previous to the pandemic. In other words, employees in a critical sector are leaving their jobs in droves. To me, this points to the utter failure of a system which has been coddling defiant anti-vaxxers and their families. But more on that in my next Coronavirus Dashboard.

Tuesday, January 4, 2022

First data releases of 2022 confirm manufacturing strength, construction slowdown


 - by New Deal democrat

The first December data, the forward-looking ISM manufacturing report, has been released. Yesterday construction spending for November was also released. Let’s take a look at both.


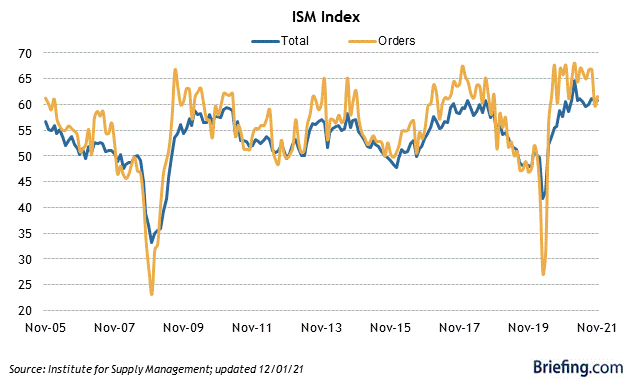
The ISM index, especially its new orders subindex, is an important short leading indicator for the production sector. In December the index declined from 61.1 to 58.7, as did the more leading new orders subindex, which declined from 61.5 to 60.4 (note the breakeven point between expansion and contraction is 50):


Both the total index and the new orders subindex ran extremely hot throughout 2021, and the moderate decrease in December remains consistent with a “hot” manufacturing sector. This continues to forecast a strong production side of the economy through mid year 2022.

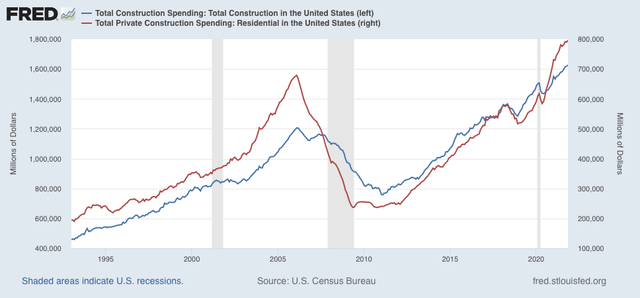
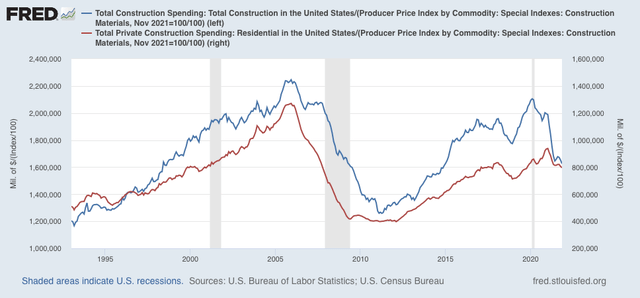
Turning to construction, during November in nominal terms overall spending including all types of construction rose 0.4%, from an upwardly revised 0.4% for October, while spending on the leading residential sector rose 0.9%. Both made new all-time highs:


Adjusting for price changes in construction materials, which jumped 2.1% in November, “real” construction spending declined -1.6% m/m, and “real” residential construction spending declined -1.1%. In absolute terms, “real” construction spending has declined sharply - by -18.8%) - since its peak in November 2020,  while “real” residential construction spending has declined -15.1% since its post-recession peak in January of this year:


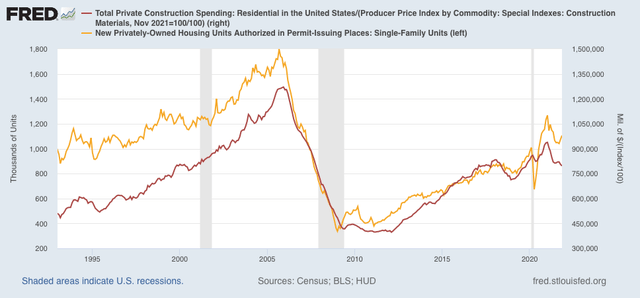
While total construction spending declined by more than it had before the Great Recession, the decline in residential construction spending, while increasingly substantial, remains nowhere near the big decline it suffered before the end of 2007, in this series that only dates from 1993. Comparing it with single family permits (gold), below:


confirms the slowdown since one year ago, but not a recession level decline.

Monday, January 3, 2022

Grading my 2021 forecasts


 - by New Deal democrat

Critical self-examination is, or at least ought to be, part of the process of making forecasts. After all, how can you learn if you don’t see how earlier hypotheses panned out? As I have usually done, let’s take a look back at how I forecast 2021 was going to look, to see how well I did.

To make a long story short, according to the long and short leading indicators I track, there was never any real doubt that the economy was going to continue to expand. The only issue was how strong or weak the expansion might be.

Last January, the  short term indicators suggested that the expansion would slow down in the first half of 2021: 

“the pandemic is still in control. The LEI has been consistently positive, but at a sharply decelerating rate, for the past 8 months. That suggests a continued but slowing expansion through spring into early summer.”

The long term forecast at that point for the latter part of 2021 was even better:

“There are 6 positives . . . There is 1 mixed indicator . . . [and] There is 1 negative . . . .

“In conclusion, the long leading indicators support a firm, even strong expansion through the remainder of 2021, the pandemic is controlled or resolved via vaccinations and intelligent Federal policy.”

At the same time, the housing market and corporate profits as reported in the Q4 2020 GDP report sounded a caution for later in the year:


“these [housing sales, real residential investment, and proprietor’s income] are a caution flag that, while the economy is likely to boom - or close to it - this year once the pandemic is contained, by year-end that growth may slow considerably

“Put the data points together and, while they are not a warning, they are a yellow cautionary flag that gains in the economy brought about by the 2020 housing boom may abate if not reverse by year-end 2021.”

At midyear, I updated the forecast for the second half of 2021 based on the short term indicators. The conclusion was again straightforward:

“with very few exceptions all of the indicators for the next 6 months of the economy, through and past the end of the year, are very positive, confirming in the short term the message of the long leading indicators in the second half of 2020.”

updated that a little later in the teeth of the Delta wave:
 
“My base case for this year has been that with Federal stimulus and accommodating monetary policy, as the economy reopened from the worst levels of the pandemic, there has been an outright Boom. The pandemic - and the response thereto - remains an exogenous dispositive factor. But with 62% of adults fully vaccinated, another 11% partially so, and with final approval of one vaccine likely to lead very quickly to widespread public and private vaccine mandates, I expect its impact to wane considerably once the Delta wave crests and just as quickly recedes.


“And so, true to my "just the facts, ma'am" approach, I am forecasting that the economy will continue to expand broadly over the next 6 months.”

So, as fo the end of 2021, what do the coincident indicators look like for the year?

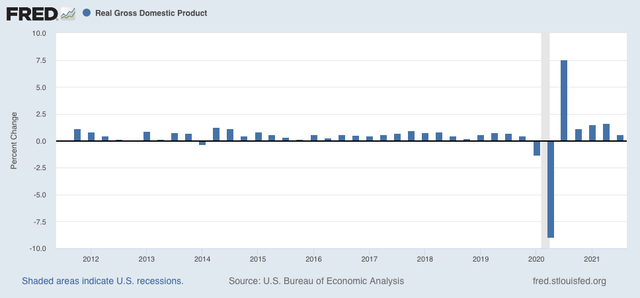
Here is real GDP growth measured quarter over quarter:


The economy did indeed continue to grow, and with the exception of Q3 of 2021 (which at +0.6% annualized was still average for the past 10 years), grew very strongly compared with the entire 10 year expansion that preceded the pandemic.

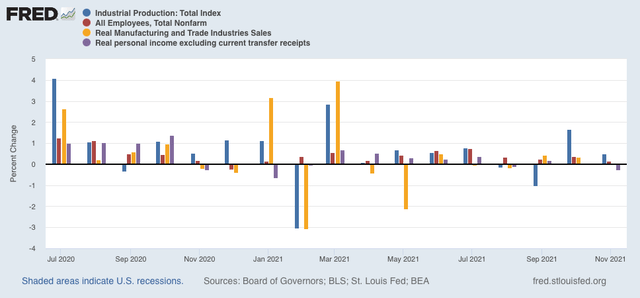
Here are the “big 4” coincident indicators, including industrial production, jobs, real income, and real sales through November:


With the exception of February and November, all of the months were positive, and especially so in spring and summer.

In conclusion, the long and short term leading indicators did their jobs very well in forecasting the expansion, even Boom, of 2021. The one portion where I fell short had to do with the course of the pandemic in the latter part of the year, as the stubborn minority of anti-vaxxers allowed COVID a large reservoir of available new victims to infect, especially as the super-infectious Omicron variant came along at year end.

In the next several weeks, I will post my short and long term forecast for 2022 using the very same methods that were so successful last year.

Sunday, January 2, 2022

Weekly Indicators for December 27 - 31 at Seeking Alpha


 - by New Deal democrat

The last edition of Weekly Indicators for 2021 is up at Seeking Alpha.

I have been watching restaurant reservations for the first signs of the economic impact of Omicron. Well . . . .

Additionally, interest rates are hitting an important milestone this week, that is changing some of their ratings, and with that the reading of the long leading forecast.

As always, reading the post should bring you up to the moment, and reward me a little bit for bringing the information to you in a cohesive, logical format.

Friday, December 31, 2021

Hopeful New Year


 - by New Deal democrat


In view of the continued conflagration of the COVID pandemic, I am eschewing the traditional “Happy New Year!” salutation as we end 2021 and begin 2022 in favor of the above “Hopeful New Year.” I always try to stick with the data - one of the favorite things anyone has ever said about my writing is that I appear to be “praeternaturally detached” - and that almost always staying away from the “We’re DOOOMED!!!” references, because there is always some sort of reason for hope out there, even in the darkest times.

Pandemics do not go on forever. Even before vaccinations, eventually sicknesses got around to infecting everybody who was susceptible, and ran out of quick kills. This one will be no different. As I wrote the other day, my best guess is that about 40% of the unvaccinated have already been infected. Omicron is almost certainly going to be awful in January, but on the other side, a lot more of the unvaccinated are going to have some resistance. More people will get vaccinated; better treatments will be found; and even more thorough and lasting vaccinations are likely to be ready. So I remain hopeful that 2022 will see the pandemic beginning to fade, maybe as early as this spring.

The economy is humming along nicely. We have a competent President, who displays empathy and common decency. 

So there is every reason to hope. And that is my getting: Hopeful New Year!


P.S. On a more prosaic note, my “Weekly Indicators” post will probably go up tomorrow, and my report card for my 2021 forecasts at some point by next week.  See you then.

Thursday, December 30, 2021

The labor market closes out 2021 on the best note yet


 - by New Deal democrat

The final economic data in 2021 was this morning’s report on initial and continued jobless claims. And the good news for workers continued.


New claims declined back under 200,000 to 198,000, the best pandemic showing except for November 20’s 194,000, and December 4’s 188,000. The 4 week average of new claims declined to 199,250:


This is the best showing for the 4 week average in over 50 years, since the end of 1969:


Continuing claims for jobless benefits also declined to a new pandemic low of 1,716,000:


Except for 2018-19, this is also the lowest showing since 1974:


This is essentially the tightest market for employees in nearly 50 years. It is no surprise that wages have been rising sharply. We can expect this situation to continue so long as the pandemic keeps many potential workers (on the order of 4,000,000 or so) on the sidelines.

In the next few days, I’ll post my retrospective report card on my 2021 forecasts from 6 and 12 months ago. Then next week I’ll be back at it again for 2022.

Wednesday, December 29, 2021

Coronavirus dashboard for year-end 2021: the Graph of the Year, where we are now, and where we are probably going


 - by New Deal democrat

At the end of the 2nd year of the pandemic, a little self-assessment of what I got right and wrong, where we are and where we are probably going.


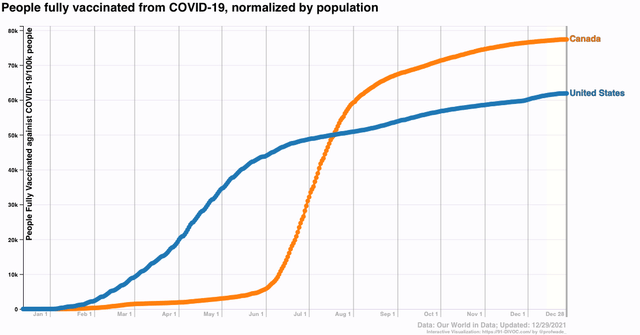
The one thing I got wrong in a big way is explained by this Coronavirus Graph of the Year:


I thought sure that once the effectiveness of the vaccines was widely known, opposition and reluctance to taking them would sharply decline. I did not expect the volume and intensity and orchestration of the anti-science, anti-vax campaign by Fox News and RW nutjobs. As a result, since mid-April the number of people getting vaccinated steadily declined from 2 million per day in early April until by July it was only about 250,000 per day. Just stunning. And it never picked up meaningfully since, only hitting about 500,000 per day several times when new age groups were approved for the jab.

And as a result, when Delta and now Omicron appeared, they still had fertile ground in which to grow rampantly.

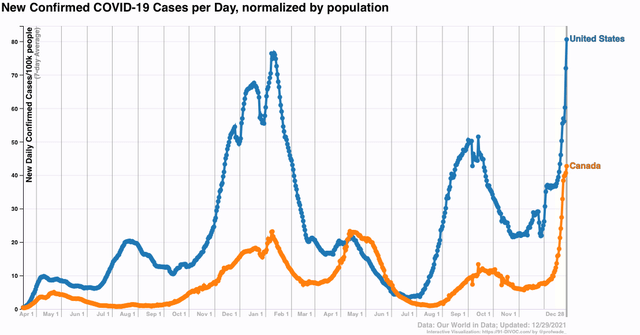
By contrast, our neighbor Canada started later, but much more quickly got to 2/3’s and then 3/4’s of their entire population being fully vaccinated. As a result, they had a much milder Delta wave:


With Omicron, unfortunately, it would probably take something like 90% of the population being fully vaccinated to keep it from taking off. Canada may get there, but the sad truth is, the US *never* will.

By contrast, I just about nailed the trajectory of the Delta wave, using India, Israel, and the UK as my “leading indicators.” In all three, it appeared that Delta took 1.5-2 months to crest, and another 1.5-2 months to retreat. I used that as a template for what would happen in the US, and indeed in the US the Delta wave crested a little under 2 months after it started, and retreated for about 1.5 months thereafter. I was also in the ballpark very early about the number of daily cases and deaths at peak.

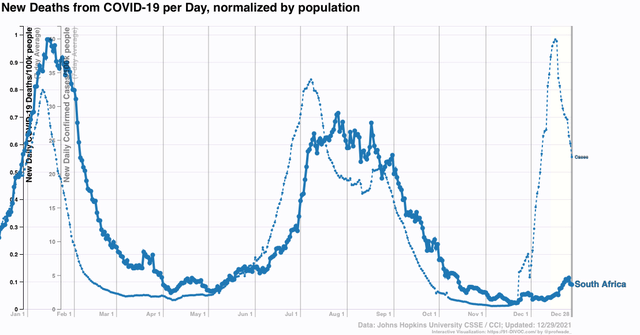
Now we are dealing with Omicron. I am hopeful (in a least-worst sort of way) that Omicron will do what Delta didn’t quite accomplish: infecting so many of the unvaccinated that a critical mass of the population builds up significant resistance to virulent repeat infections.

Here’s what the Omicron trajectory looks like in South Africa:


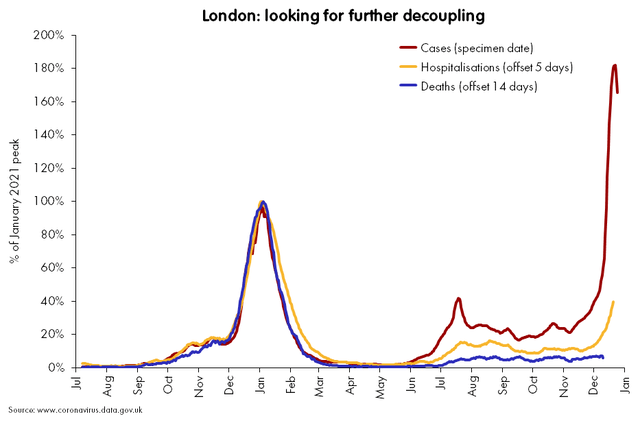
and here is London in the UK:


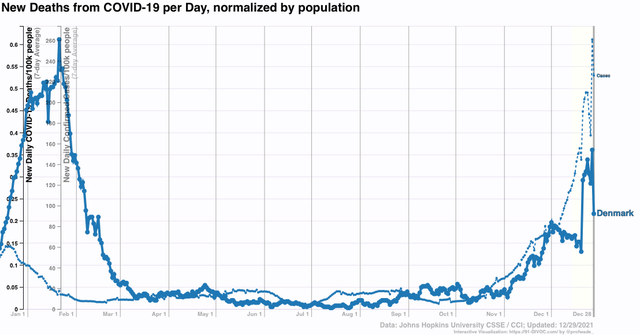
And here is Denmark, another early country where Omicron took off:


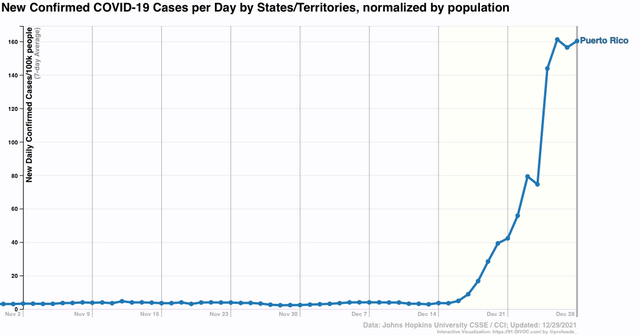
And finally, here is Puerto Rico, where over 80% of the population was fully vaccinated before Omicron:


Puerto Rico, like Canada, shows that even 75% or 80% of a population fully vaccinated wasn’t enough to stop Omicron. But Puerto Rico, like South Africa, like London, and like Denmark, appears to show that Omicron rushes in like SuperDelta, peaking only 30-40 days after the initial cases. While it’s too soon to say for Canada or Puerto Rico, in the case of South Africa, and probably London and Denmark as well, there has been an order of magnitude fewer deaths than with prior similar waves of infection. The jury is still out on this, but as “leading indicators” these places give ample room for hope.

If the US as a whole follows South Africa and others, then Omicron will peak by early to mid-January, probably at 400,000 or more cases per day. But we might get lucky and never exceed the roughly 2200 mark of deaths daily set at the peak of Delta.

What then? The idea of eradication is long gone, not only because of how poorly so many humans have behaved in the US and elsewhere, but ultimately because the disease has ample additional animal reservoirs, such as deer and even house cats. Covid is going to become endemic. But as more and more people get infected with various strains, and more and more people are also vaccinated against those strains, it will find a smaller pool of people able to be infected. In other words, I expect successive waves to become smaller and smaller until ultimately COVID, while a big problem for people with poor immune systems, becomes part of the background noise of health.

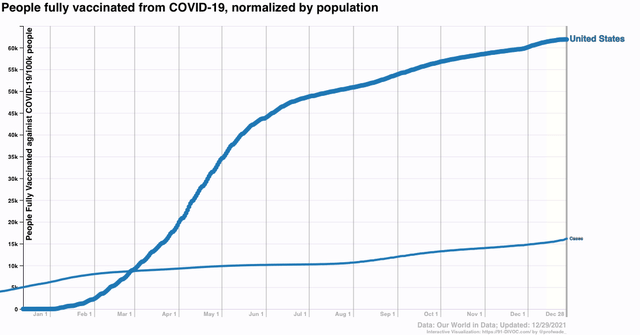
Here again is the graph of the % of people fully vaccinated in the US, plus the total number of cases in the US, both on the same scale:


Since we know that about half of all COVID cases are asymptomatic, the likelihood is that 1/3rd or more of all Americans have been infected. And since the middle of the year, probably about 90% of those infected are among the unvaccinated.

On June 30, about 50% of people were fully vaccinated, and about 10% of the population had confirmed infections. Double that % of infections, and adjust for the fact that about 50% of prior infections were to people subsequently vaccinated, and you wind up with about 50%+10%, or 60% of the US population probably having some resistance. Fast forward to now, with about 62% of the population vaccinated, and another 6% of the population having subsequently been confirmed as infected, probably 90% of whom were unvaccinated, and you get 62% + 10% + (.9*2*6)% = 62%+10%+11%, or 83% of the US population with some resistance to COVID. 

I think by the end of winter that last number could approach 90%. We may also get the last batch of young children approved for vaccination. In short, in other words, I am not fatalistic, and remain hopeful that by spring, the reservoir of easy pickings for COVID in the US will have shrunk enough that subsequent waves will be progressively smaller, and progressively less fatal.

Tuesday, December 28, 2021

House price increases continue to show strong market at the end


 - by New Deal democrat

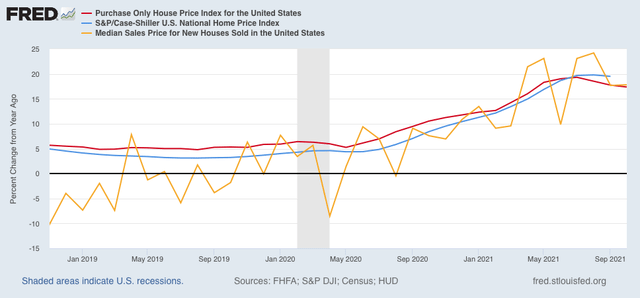
The last housing market data for 2021, the FHFA and Case Shiller house price indexes, were reported this morning. Both showed a very slight deceleration in the soaring prices that have marked this year.


The FHFA purchase only index rose 1.1% for October. The YoY% increase was 17.4%, down from the 19.3% YoY peak in July. Meanwhile the Case Shiller national index rose 0.8% m/m, and is up 19.1% YoY, vs. its peak of 19.8% in August. This is similar to what we have already seen with the median prices of new houses for sale (gold):


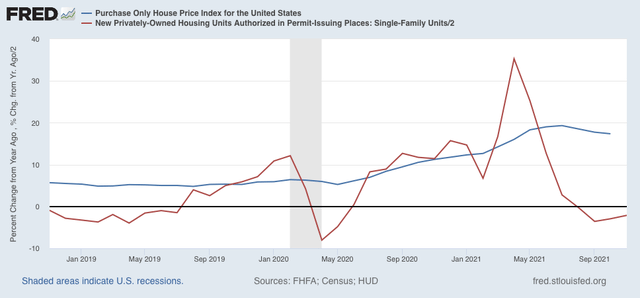
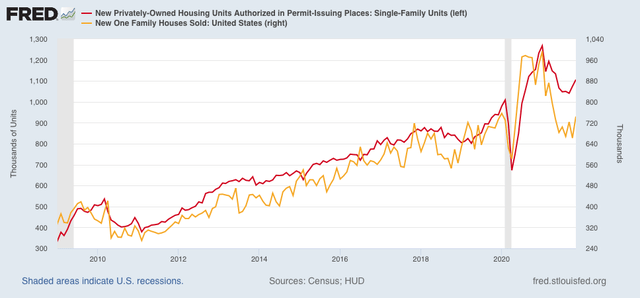
As I always note, prices follow sales. Below are new home sales and single family housing permits (red, /2 for scale) vs. the FHFA index as above:


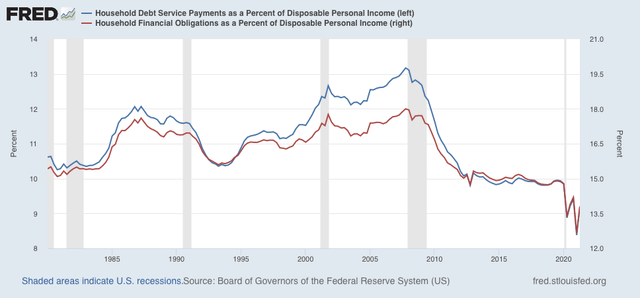
As expensive as houses are, they have not yet reached a crisis point as they did in 2006. This is because, although both average hourly wages and house price have increased roughly 60% since that time, mortgage rates, are just over 3% vs. 6.5% or higher back then. In other words, the amount of disposable income it takes the average household to service their mortgage and other debts in 2021 is only about 2/3’s of what it was at the peak of the housing bubble in 2006:


So while both single family housing permits and new home sales have been down as much as 30% this year from their peak at the end of last year, they remain even with their best performance in the entire decade leading up to the pandemic:


This is not a housing market that is in any serious trouble. While the downturn in housing activity this year will create a drag on the economy next year, it is very unlikely to put the economy as a whole into a recession. 

Sunday, December 26, 2021

Weekly Indicators for December 20 - 24 at Seeking Alpha


 - by New Deal democrat

My Weekly Indicators post is up at Seeking Alpha.

Surprisingly, so far the Omicron variant has had no deleterious effect on any of the data, and in particular, on restaurant reservations.

As usual, clicking over and reading will bring you up to the economic moment, and bring me a little late Christmas cash in my stocking.

Also - Programming Note: This week will also be very light on data, with two house price indexes on Tuesday, and jobless claims on Thursday. While I suspect there will be the need for a coronavirus update < sigh >, don’t be surprised if I play hookie one or two days again.

Thursday, December 23, 2021

Income, spending, layoffs, and new home sales all point to a continuing expansion in 2022


 - by New Deal democrat

We got our last batch of data before Christmas this morning. Almost all of the news was positive. I will be very brief.


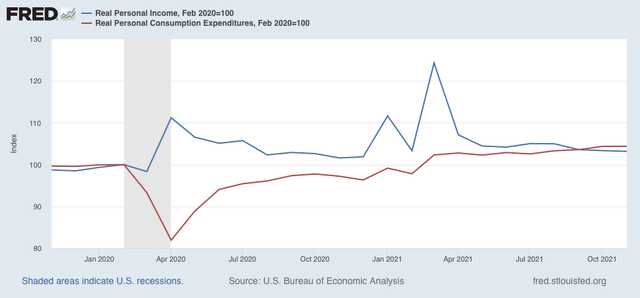
In the “coincident indicators” department, real personal income declined -0.2%, while real personal consumption expenditures increased less than 0.1%, although both remain well above their pre-pandemic levels: 


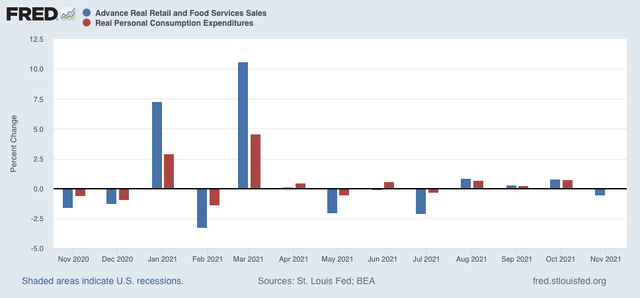
Comparing real personal consumption expenditures with real retail sales for November (essentially, both sides of the consumption coin) reveals both faltered, but not in any way worth being worried about:


In the “short leading indicators” department, nobody continues to get laid off. Initial claims were unchanged for the week at 206,000, while the 4 week average rose slightly to 206,250. Continuing claims (right scale) declined to yet another pandemic low of 1,859,000:


The employment economy continues to be very “hot.” This is a very good sign for the next few months.

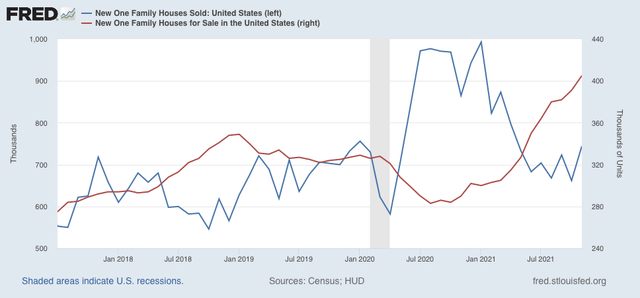
Finally, in the “long leading indicators” department, new home sales rose to a 6 month high, while the inventory of new homes for sale (which lag) rose to a 13 year high:


At least when it come to new house, the imbalance of inventory is being worked out, while the trough in sales from summertime is almost certainly behind us.

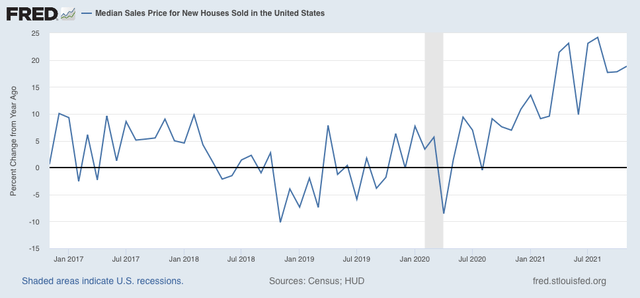
Meanwhile the YoY growth in house prices continued to abate - a little - from late spring and summer highs:


The housing market, which had been a negative this summer, has turned back into a positive for year-end 2022.

In summary, the expansion should continue.

Wednesday, December 22, 2021

Final existing home sales report of 2021 is positive


 - by New Deal democrat

As we wind down the year, most of the remaining data will be from the housing sector. Tomorrow we get new home sales, then next week one final round of house price indexes. 

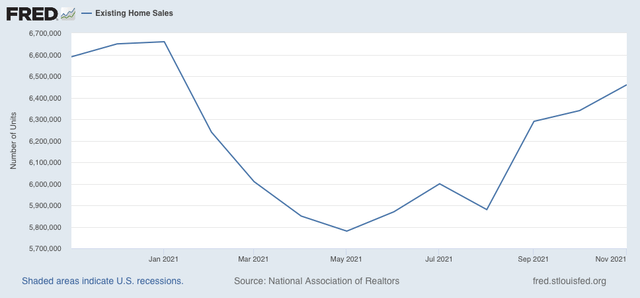
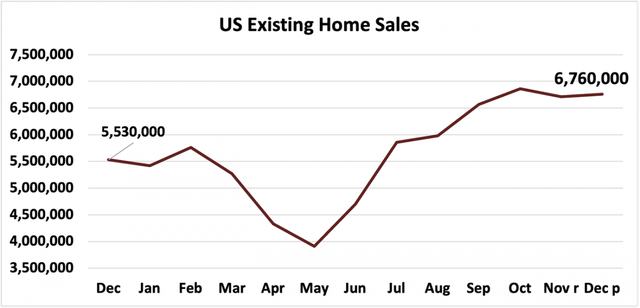
Two months ago I wrote that “I suspect new home sales will increase, since interest rates stabilized at very low rates earlier this year, and the increase in existing home sales is some confirmatory evidence.” Since then, sales increased in October by 0.8%, and today existing home sales for November were reported, and the news continued positive, as sales increased another 1.9%, from 6,340,000 annualized to 6,460,000. This is the highest number since January of this year, and aside from the period from September last year through January, the highest since 2007 (note the NAR only permits FRED to publish the last year of numbers:


Here is the graph from exactly one year ago, covering 2020:


As CNBC said at the time, “Pandemic-driven demand sent total 2020 home sales to the highest level since 2006.”

On a YoY basis, sales are only down 2%, the best comparison in months.

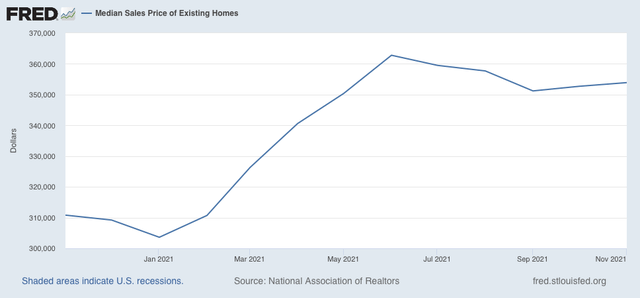
Median prices of existing homes are not seasonally adjusted. On a YoY basis, they were  up 13.9%:


Since the “the cure for high prices is, high prices,” I have been tracking YoY median price gains over the last 6 months:

Jun +23% (YoY high)
Jul +20%
Aug +15%
Sep +13%
Oct +13%
Nov +14%

While these are not seasonally adjusted either, my rule of thumb is that a deceleration of 50% typically marks the top for any such statistic. Since we have stabilized at above 12.5%, this is evidence that, on a seasonally adjusted basis, prices have continued to increase, although at a less dizzying pace.

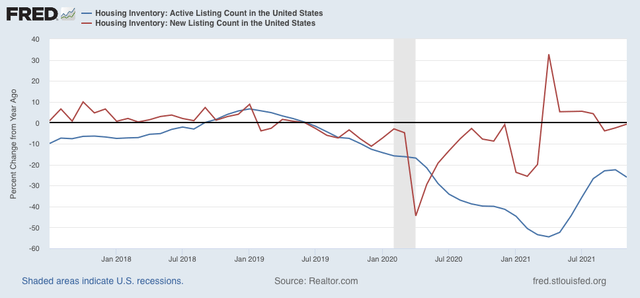
Finally, Realtor.com does provide FRED with both new and total (“active”) listing counts for the past 5+ years. Since these are also not seasonally adjusted, here is the YoY look at both:


New listings declined precipitously in late 2019 even before the pandemic - and the pandemic certainly hasn’t helped. But new listings have almost completely recovered YoY, now down less than -1% since last November; while total listings have continued to decline, albeit less precipitously.

This is not a market that is about to roll over. I suspect new inventory will go positive YoY shortly, and price gains will moderate, although not disappear. If new home sales similarly advance tomorrow, that will augur well for 2022.


Tuesday, December 21, 2021

Coronavirus dashboard for December 21: exponential spread is here


 - by New Deal democrat

As I warned you on Saturday, there might be some hooky-playing this week; and as I also said, that was “Omicron permitting.”


Well, Omicron warrants an update today. Because exponential spread is underway especially in those parts of the country most exposed to international visitors.

But first, in the spirit of leading indicators, let’s take a look at South Africa, where Omicron was first reported, and which has an excellent reporting system.

Here are deaths (solid line) vs. cases (dotted line) per capita for the whole country (note differences in scale) for the past year. In all previous waves of infection, including a previous wave during summer 2020 not shown, deaths followed cases by one month or less:
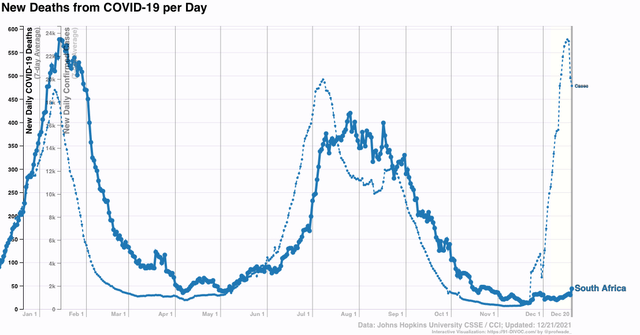


Cases began to rise almost exactly 5 weeks ago, from just under 300 to over 23,000 three days ago - and have already fallen back to 19,400. Meanwhile deaths have risen from 13 four weeks ago to 44. Undoubtedly deaths will continue to rise. The question is, how much?

For some help, here is a look by Conor Kelly at cases, hospitalizations, and deaths in Gauteng, the first area of South Africa to be hit:
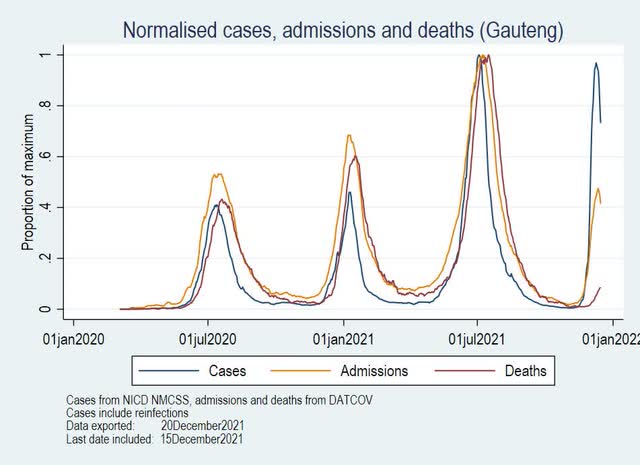

Note that hospitalizations and deaths rose comparably in the three previous waves. This time around, hospitalizations appear to have peaked at only half the level of cases, as normalized in the graph. This is really good news. Meanwhile deaths have clearly started to rise, but there is some indication that they have stayed low longer after the onset of this wave than for previous waves. This appears to be confirmed by the following graph comparing deaths in the first two weeks of the present Omicron wave, with previous waves:
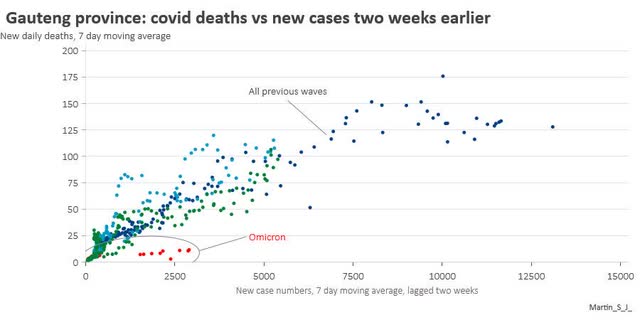

In other words, our “leading indicator” example of South Africa lends credence to the idea that hospitalizations and deaths will not be so severe, on a per capita basis, as a result of Omicron than with Delta or other prior waves.

This is good news.

Turning to the US, the CDC made a splash yesterday by announcing that its model suggests that 73% of all cases in the US now are Omicron. Here’s their graph:
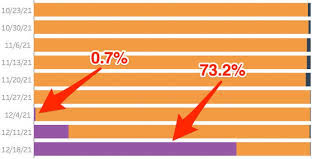

But take the CDC’s announcement with a shaker full of salt. In a footnote at its “Nowcast” site, it advises that the graph is bases on four weeks of data *ending November 27,* i.e., four weeks ago! It’s confidence interval includes about 2/3’s of all possible percentages. And it made very major revisions to last week’s estimate, increasing that from 2% to about 30%. In short, the CDC’s number is *very* unreliable.

By contrast, here is Trevor Bedford’s log scale *actual* data, through 12 days ago, of cases in the US and 8 other countries:
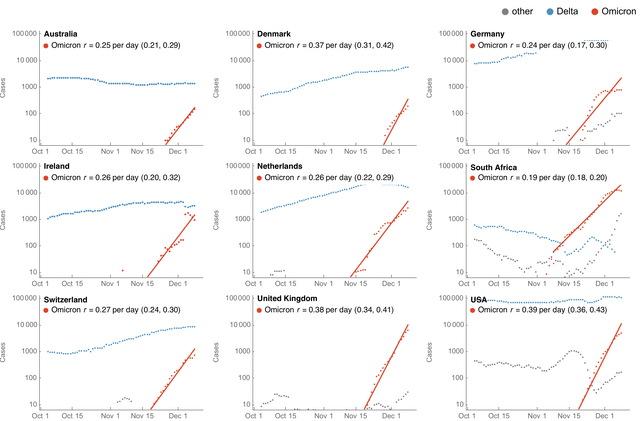

Projecting Bedford’s trendline forward 12 days suggests that right now about 33% of all cases in the US are Omicron.

That’s a very major difference, not just because of the numbers, but because in the CDC’s version, Delta has been knocked back to about 35,000 cases, whereas in Bedford’s Delta’s number is about constant at 80-90,000 cases. In other words, the CDC has Omicron supplanting Delta, but Bedford does not, at least in the US - although his graph for South Africa does indeed suggest that Delta cases have declined by about 2/3’s since Omicron emerged at the beginning of November.

There is another intriguing trend in Bedford’s graphs, because most countries also provide a record for “other” variants in addition to Omicron and Delta.  Looking at South Africa, “other” cases have risen even faster than Omicron since one month ago, and are responsible for about 10% of all cases there now. A similar trend appears to have started in Germany, the UK, and the US as well. I have not read of any explanation of this from any expert.

Finally, let’s look at where we have exponential spread in the US. Here are NY, NJ, and RI:
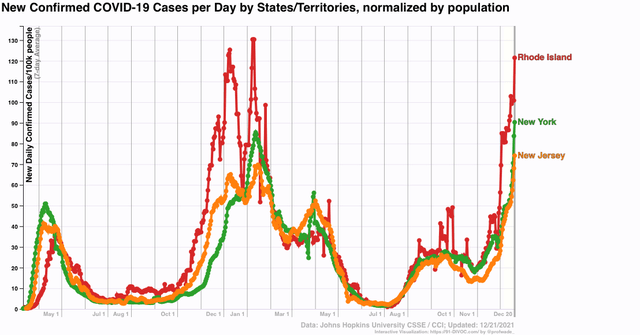

NY and NJ both set new records as of today. RI is not far behind.

Next, here are OH, DC, HI, and PR:
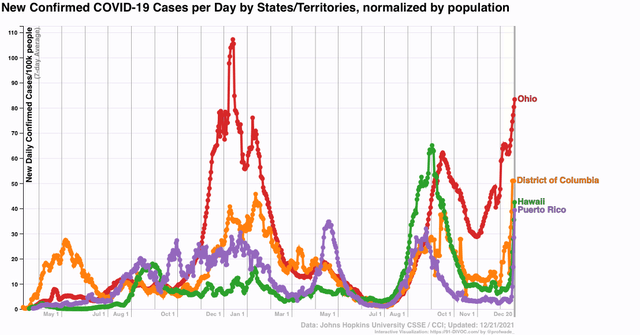

HI and PR are two tropical island oases that had been doing extremely well. Both are 80% or more vaccinated, and PR in particular recently had as few as 2 cases per 100,000 daily. This week PR shot up to 40 cases per 100,000 in *four days!*

Of course, HI and PR are tourist destinations, and have heavy international travel as does the NYC area.

And of course we all know one other State that has a similar profile: FL. Here is FL’s official case count, which they are still only updating once a week:
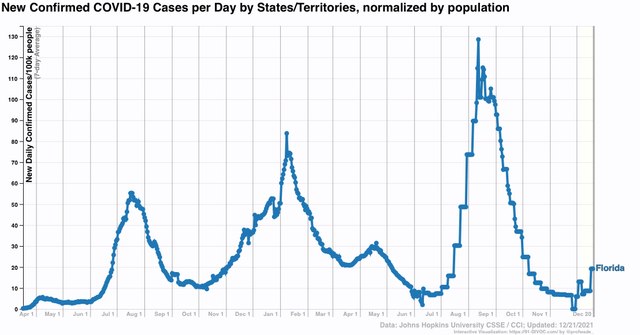

Rising, but still very low.

Except when you bypass the State, and get reports directly from counties and hospitals, here is what the daily total looks like (from the NYT):
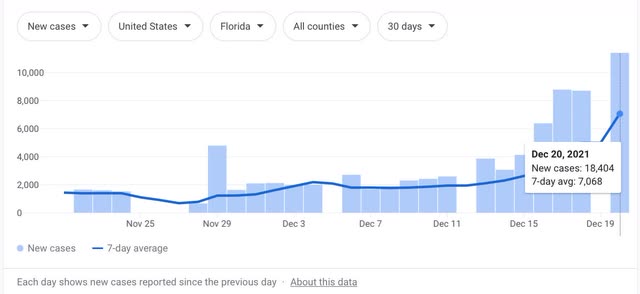

As of yesterday, cases in FL were *triple* what they were just one week prior. Expect a huge increase in FL’s next weekly report this Friday.

I expect the exponential outbreak to grow both in terms of numbers and to spread throughout the entire country in the next week or two. We can hope that in the US, as in SA (and apparently in London in the UK as well), cases will peak about 30 to 40 days after the onset of the wave, and decline rapidly thereafter. And we can pray that, as appears increasingly likely in SA, the burden of hospitalizations and deaths does not grow at the same rate as cases.


Saturday, December 18, 2021

Weekly Indicators for December 13 - 17 at Seeking Alpha


 - by New Deal democrat

[Brief programming note: this coming week will only see existing home sales on Wednesday, and new home sales plus jobless claims on Thursday. In other words - don’t be surprised if I take a couple of days off. Omicron permitting]

My Weekly Indicators post is up at Seeking Alpha.

While the large majority of the strictly economic data continues positive in all time frames, it can be trumped at a moment’s notice by Omicron.

I expect the comments on this week’s post at that site to be “interesting,” but not in an intellectually challenging way, if you catch my drift and I think you do.

In any event, clicking over and reading will bring you up to the virtual economic moment and pay for my postage to send out all my Christmas gifts.
Friday, December 17, 2021

Coronavirus dashboard: an urgent warning about Omicron’s exponential spread


 - by New Deal democrat

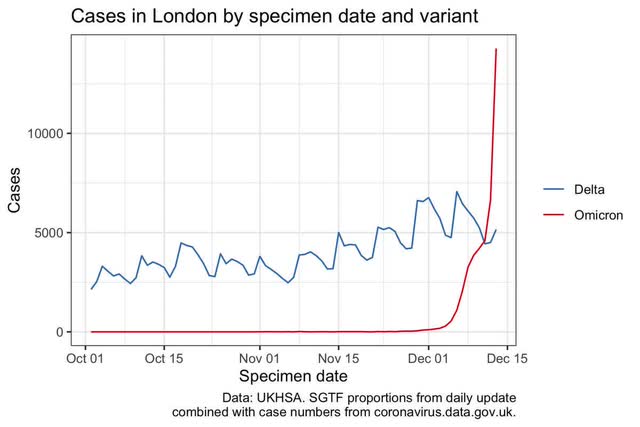
Here is a graph of the growth in Omicron vs. Delta cases in London from 2 days ago:
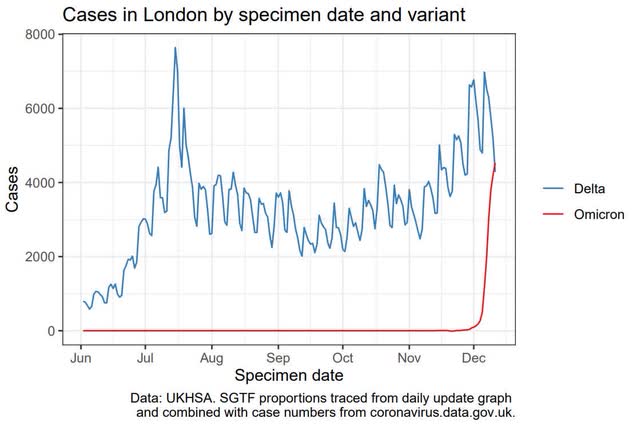

Shocking, isn’t it?

Now here is the same data, updated yesterday, just one day later:


Do I have your attention? In one day, the number of Omicron cases literally went through the top of the previous graph.

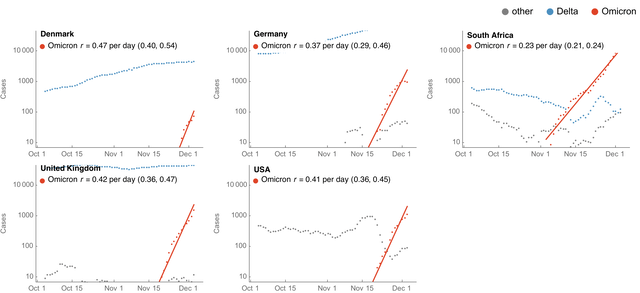
Dr. Trevor Bedford, a geneticist who was the first to demonstrate that there was community spread of Covid-19 in the US back in late February 2020, is now tracking the daily exponential growth of Omicron, with a 10 day lag because that is how long it takes for reliable testing data to be accumulated. Here are his current graph of 5 countries including South Africa, the UK, and the US:

https://github.com/blab/rt-from-frequency-dynamics/tree/master/results/omicron-countries

Depending on the country, the number of Omicron cases is doubling every 2 to 3 days. 

As of 10 days ago, he estimates about 1000 cases per day in the US were Omicron. If we use 3 days as the doubling time, that is close to 10,000 cases today.

Projecting that rate of growth forward, here is what we get:

- about 100,000 cases a day by December 27 

- 1 million cases a day by January 6

-10 million cases a day by January 16.

This in a health system where many hospitals have already reached their limit.

Will it get that bad? Exponential growth keeps going until, well, it doesn’t (see, e.g., Delta during July and August, peaking quickly just before Labor Day).

In that regard, in South Africa, Omicron May have peaked a few days ago, see:


If Delta burned through the dry tinder in about 2 to 3 months, in South Africa Omicron sped that up to about 30 to 45 days.

In South Africa, cases went from 400 to 24,000 in 4 weeks, an 60-fold increase.

Two other countries with major Omicron spread, Denmark and Norway, went from 400 cases each to 8000 and 4000, respectively, a 20-fold and 10-fold increase. Interestingly (although I won’t bother with the graph, in Norway cases seem to have peaked in the last few days after 12 weeks of increase). The good news is, if South Africa and Norway are the templates, then like Delta there is a certain subset of the population that is uniquely susceptible, and once Omicron infects those people, it runs out of fuel.

Consistent with, and maybe because of this, here is Dr. Andy Slavitt:
https://mobile.twitter.com/Porter_Anderson/status/1471683867304206337

“We’re in store for a quick, fast-spreading, and hopefully soon-to-be-over wave that’s going to overwhelm hospitals. All of us who take advantage of the science will be in good shape. For the country as a whole, this is going to be a rough January.”

As cases rise, when could they peak? He says: “I talked to a dozen scientists or so in the last couple of days and the consensus seems to be forming around the third week in January.”

In the US, the post-Delta trough was about 75,000 cases per day about 6 weeks ago. A 10-fold increase like Norway would be 750,000 cases per day. A 50-fold increase, like South Africa, would be 3,750,000 cases per day.

Since the consensus spoken of by Dr. Slavitt is late in January, that appears to be consistent with the worst-case scenario.

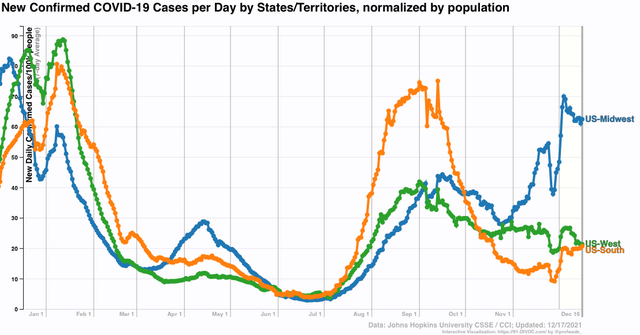
While cases in the South, West, and Midwest are generally still much better than they were one year ago at this point:


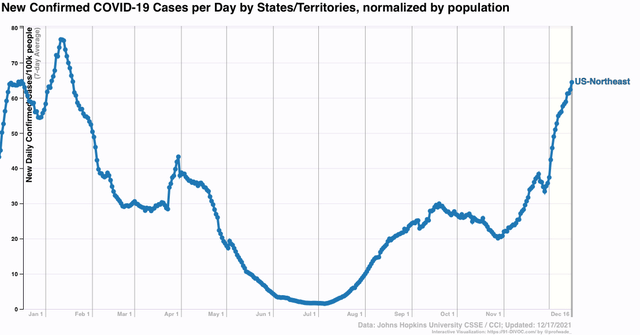
In the Northeast, where there is evidence Omicron is already a significant share of total infections, cases are already close to their all-time daily highs, and look to exceed those numbers by Monday or Tuesday:


I am afraid this is what the US as a whole is looking at within a week or two, if not within days.

If the above is true, at some point between now and New Year’s Day there is going to be a March 2020 style nearly instant crash in public and economic activity.

Please use extra caution, even if you are fully vaccinated and boostered. Stay safe!