Saturday, July 4, 2020

Frederick Douglass’s oration on the 4th of July (abridged)


 - by New Deal democrat

The middle portion of Douglass’s famous speech, delivered in 1852 to white abolitionists in Rochester, NY, where Douglass lived at the time, and is buried — “What, to the American slave, is your 4th of July?” — is best known.

But in the first portion he allowed for celebration of the principles enunciated by the Founders in the Declaration of Independence: “your fathers, the fathers of this republic, did, most deliberately, under the inspiration of a glorious patriotism, and with a sublime faith in the great principles of justice and freedom, lay deep the corner-stone of the national superstructure.”

And in the Concluding portion, he “dr[e]w[ ] encouragement from the Declaration of Independence, the great principles it contains, and the genius of American Institutions” for the future.

In our own moment of critical trial and literal iconoclasm, Douglass’s ability to see the Founding Fathers as 3 dimensional, lauding their accomplishments as well as damning their collusion in evil, and for girding one’s loins to the crisis of the present, with abiding hope for the universality of decency and justice in the future, is particularly inspiring. 
____________________

The papers and placards say, that I am to deliver a 4th [of] July oration. 
The fact is, ladies and gentlemen, the distance between this platform and the slave plantation, from which I escaped, is considerable—
This, for the purpose of this celebration, is the 4th of July. It is the birthday of your National Independence, and of your political freedom. This, to you, is what the Passover was to the emancipated people of God. It carries your minds back to the day, and to the act of your great deliverance; and to the signs, and to the wonders, associated with that act, and that day. This celebration also marks the beginning of another year of your national life; ... The eye of the reformer is met with angry flashes, portending disastrous times; but his heart may well beat lighter at the thought that America is young, and that she is still in the impressible stage of her existence. May he not hope that high lessons of wisdom, of justice and of truth, will yet give direction to her destiny? Were the nation older, the patriot’s heart might be sadder, and the reformer’s brow heavier. Its future might be shrouded in gloom, and the hope of its prophets go out in sorrow. There is consolation in the thought that America is young. ....
... there was a time when to pronounce against England, and in favor of the cause of the colonies, tried men’s souls. They who did so were accounted in their day, plotters of mischief, agitators and rebels, dangerous men. To side with the right, against the wrong, with the weak against the strong, and with the oppressed against the oppressor! here lies the merit, and the one which, of all others, seems unfashionable in our day. The cause of liberty may be stabbed by the men who glory in the deeds of your fathers. But, to proceed....
....
On the 2d of July, 1776, the old Continental Congress, to the dismay of the lovers of ease, and the worshipers of property, clothed that dreadful idea with all the authority of national sanction. ....
Citizens, your fathers made good that resolution. They succeeded; and to-day you reap the fruits of their success. The freedom gained is yours; and you, therefore, may properly celebrate this anniversary. The 4th of July is the first great fact in your nation’s history—the very ring-bolt in the chain of your yet undeveloped destiny.
Pride and patriotism, not less than gratitude, prompt you to celebrate and to hold it in perpetual remembrance. I have said that the Declaration of Independence is the ring-bolt to the chain of your nation’s destiny; so, indeed, I regard it. The principles contained in that instrument are saving principles. Stand by those principles, be true to them on all occasions, in all places, against all foes, and at whatever cost.
From the round top of your ship of state, dark and threatening clouds may be seen. Heavy billows, like mountains in the distance, disclose to the leeward huge forms of flinty rocks! That bolt drawn, that chain broken, and all is lost. Cling to this day—cling to it, and to its principles, with the grasp of a storm-tossed mariner to a spar at midnight.
....
Fellow Citizens, I am not wanting in respect for the fathers of this republic. The signers of the Declaration of Independence were brave men. They were great men too—great enough to give fame to a great age. It does not often happen to a nation to raise, at one time, such a number of truly great men. The point from which I am compelled to view them is not, certainly, the most favorable; and yet I cannot contemplate their great deeds with less than admiration. They were statesmen, patriots and heroes, and for the good they did, and the principles they contended for, I will unite with you to honor their memory.
They loved their country better than their own private interests; and, though this is not the highest form of human excellence, all will concede that it is a rare virtue, and that when it is exhibited, it ought to command respect. He who will, intelligently, lay down his life for his country, is a man whom it is not in human nature to despise. Your fathers staked their lives, their fortunes, and their sacred honor, on the cause of their country. In their admiration of liberty, they lost sight of all other interests.
They were peace men; but they preferred revolution to peaceful submission to bondage. They were quiet men; but they did not shrink from agitating against oppression. They showed forbearance; but that they knew its limits. They believed in order; but not in the order of tyranny. With them, nothing was “settled” that was not right. With them, justice, liberty and humanity were “final”; not slavery and oppression. You may well cherish the memory of such men. They were great in their day and generation. Their solid manhood stands out the more as we contrast it with these degenerate times.
How circumspect, exact and proportionate were all their movements! How unlike the politicians of an hour! Their statesmanship looked beyond the passing moment, and stretched away in strength into the distant future. They seized upon eternal principles, and set a glorious example in their defense. Mark them!
Fully appreciating the hardship to be encountered, firmly believing in the right of their cause, honorably inviting the scrutiny of an on-looking world, reverently appealing to heaven to attest their sincerity, soundly comprehending the solemn responsibility they were about to assume, wisely measuring the terrible odds against them, your fathers, the fathers of this republic, did, most deliberately, under the inspiration of a glorious patriotism, and with a sublime faith in the great principles of justice and freedom, lay deep the corner-stone of the national superstructure, which has risen and still rises in grandeur around you.
Of this fundamental work, this day is the anniversary. ....
....
I leave ... the great deeds of your fathers to other gentlemen whose claim to have been regularly descended will be less likely to be disputed than mine!
....
We have to do with the past only as we can make it useful to the present and to the future. To all inspiring motives, to noble deeds which can be gained from the past, we are welcome. But now is the time, the important time. Your fathers have lived, died, and have done their work, and have done much of it well. You live and must die, and you must do your work. You have no right to enjoy a child’s share in the labor of your fathers, unless your children are to be blest by your labors. You have no right to wear out and waste the hard-earned fame of your fathers to cover your indolence. .... 
But, .... The blessings in which you, this day, rejoice, are not enjoyed in common. The rich inheritance of justice, liberty, prosperity and independence, bequeathed by your fathers, is shared by you, not by me. The sunlight that brought life and healing to you, has brought stripes and death to me. This Fourth [of] July is yours, not mine. You may rejoice, I must mourn. To drag a man in fetters into the grand illuminated temple of liberty, and call upon him to join you in joyous anthems, were inhuman mockery and sacrilegious irony. ....
....
What, to the American slave, is your 4th of July? I answer: a day that reveals to him, more than all other days in the year, the gross injustice and cruelty to which he is the constant victim. ....
.... Americans! your republican politics, not less than your republican religion, are flagrantly inconsistent. You boast of your love of liberty, your superior civilization, and your pure Christianity, .... You glory in your refinement and your universal education yet you maintain a system as barbarous and dreadful as ever stained the character of a nation—a system begun in avarice, supported in pride, and perpetuated in cruelty. .... You profess to believe “that, of one blood, God made all nations of men to dwell on the face of all the earth,” and hath commanded all men, everywhere to love one another; yet you notoriously hate, (and glory in your hatred), all men whose skins are not colored like your own. You declare, before the world, and are understood by the world to declare, that you “hold these truths to be self evident, that all men are created equal; and are endowed by their Creator with certain inalienable rights; and that, among these are, life, liberty, and the pursuit of happiness”; and yet, you hold securely, in a bondage which, according to your own Thomas Jefferson, “is worse than ages of that which your fathers rose in rebellion to oppose,” a seventh part of the inhabitants of your country.
Fellow-citizens! I will not enlarge further on your national inconsistencies. The existence of slavery in this country brands your republicanism as a sham, your humanity as a base pretence, and your Christianity as a lie. It destroys your moral power abroad; it corrupts your politicians at home. It saps the foundation of religion; it makes your name a hissing, and a by word to a mocking earth.....
.... I differ from those who charge this baseness on the framers of the Constitution of the United States. It is a slander upon their memory, at least, so I believe. ....
.... I hold there is neither warrant, license, nor sanction of the hateful thing; but, interpreted as it ought to be interpreted, the Constitution is a GLORIOUS LIBERTY DOCUMENT. Read its preamble, consider its purposes. Is slavery among them? Is it at the gateway? or is it in the temple? It is neither. ....
Now, take the constitution according to its plain reading, and I defy the presentation of a single pro-slavery clause in it. On the other hand it will be found to contain principles and purposes, entirely hostile to the existence of slavery....
Allow me to say, in conclusion, notwithstanding the dark picture I have this day presented of the state of the nation, I do not despair of this country. .... “The arm of the Lord is not shortened,” and the doom of slavery is certain. I, therefore, leave off where I began, with hope. While drawing encouragement from the Declaration of Independence, the great principles it contains, and the genius of American Institutions, my spirit is also cheered by the obvious tendencies of the age. Nations do not now stand in the same relation to each other that they did ages ago. No nation can now shut itself up from the surrounding world, and trot round in the same old path of its fathers without interference.

Friday, July 3, 2020

Initial and continued claims show stalling progress in rehiring


 - by New Deal democrat

Weekly initial and continuing jobless claims give us the most up-to-date  snapshot of the continuing  economic impacts of the coronavirus on employment. Going on four full months after the initial shock, the overall damage remains huge, with large spreading new secondary impacts. The best that can be said is that the damage is not accelerating - but as is shown below, there is has been negligent progress in the past few weeks.

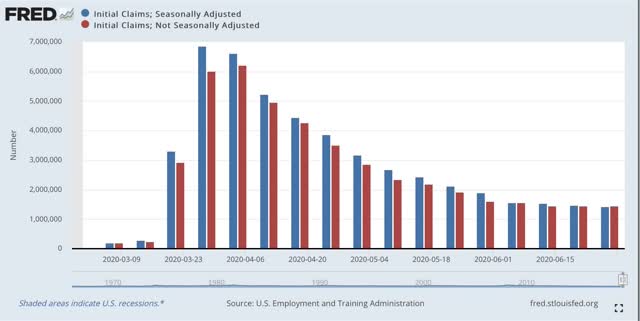
Here are initial jobless claims both seasonally adjusted (blue) and non- seasonally adjusted (red). The non-seasonally adjusted number is of added importance since seasonal adjustments should not have more than a trivial effect on the huge real numbers:


There were 1.445 million new claims, only 15,000 less than one week ago. After seasonal adjustment this became 1.270 million, “only” 59,000 less than last week’s number. While the trend of the past 45 days of slight declines in new claims continues, this is the smallest weekly decline since the worst reading in April. Further, this objectively continues to show huge second-order impacts continuing to spread.

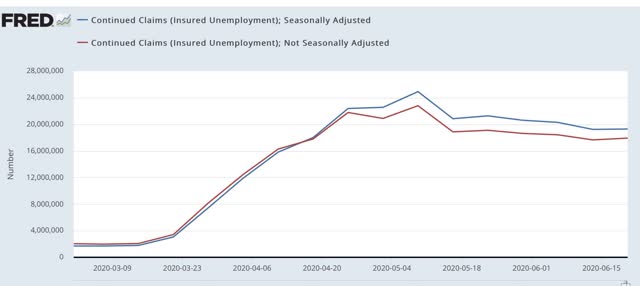
The same flattening trend is apparent in continuing claims, which lag one week behind. In the past six weeks, both the non-seasonally adjusted number (red), and the less important seasonally adjusted number (blue) have both remained essentially stationary. This week the former rose by 266,400 to 17.921 million, still 4.873 million below its peak of 22.794 million six weeks ago; while the latter rose by 59,000 to 19.290 million, 5.622 million below its peak of 24.912 million reading six weeks ago:


In other words, the spreading new damage shown by the continued huge numbers of new jobless claims is about equal to the callbacks to work from various sectors “reopening.”

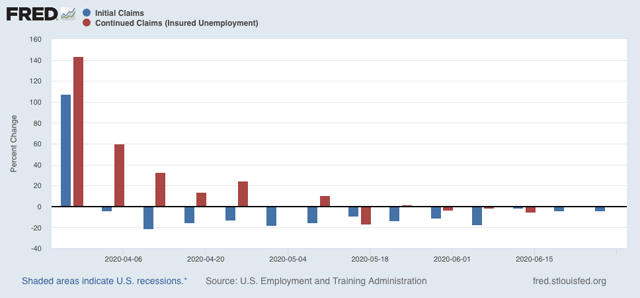
The stalled progress of both new and continued claims is apparent in the graph below, showing the percent change week over week in new (blue) and continued (red) claims:


For the last three weeks in initial claims, and the last six in continuing claims, on a percentage basis there has been little change.

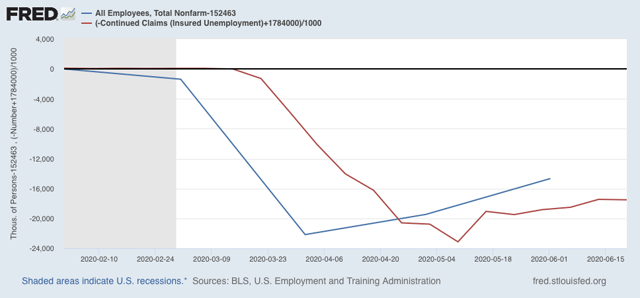
Finally, it is interesting to compare this with the payrolls numbers, including yesterday’s jobs report, which currently shows a loss of 14.661 million jobs from peak. This is less than the number of continuing claims alone, which strongly suggests that the jobs report is underestimating the damage done to the jobs market by the pandemic, as shown in the graph below:


Since claims are actual counts by the States vs. a sampled estimate in the jobs report, I am inclined to factor the former.

We’ll get a better look on Tuesday, when we get the JOLTS report, which shows both the  hiring and discharges sides of the jobs ledger. Since this will be for May, the first month of job gains after the pandemic started, it will better show us how much rehiring has been occurring.

Thursday, July 2, 2020

June jobs report: the last hurrah of the wished-for “V-shaped” coronavirus recovery


 - by New Deal democrat

HEADLINES:
  • 4,800,000 million jobs added. This makes up about 22% of the 22.1 million job losses in March and April.
  • U3 unemployment rate improved 2.2% from 13.3% to 11.1%, compared with the January low of 3.5%.
  • U6 underemployment rate improved 3.2% from 21.2% to 18.0%, compared with the January low of 6.9%.
  • Those on temporary layoff declined 4,778,000 to 10.565 million.
  • Permanent job losers increased by 588,000.
  • April was revised downward by -100,000. May was revised higher by 190,000 respectively, for a net of 90,000 more jobs gained compared with previous reports.
Leading employment indicators of a slowdown or recession

I am still highlighting these because of their leading nature for the economy overall.  These were uniformly very positive: 
  • the average manufacturing workweek rose 0.5 hours from a downwardly revised 38.7 hours to 39.2 hours. This is one of the 10 components of the LEI and will be a positive.
  • Manufacturing jobs rose by 356,000. Manufacturing has still lost 757,000  jobs in the past 4 months, or 6% of the total.
  • construction jobs rose by 158,000. Even so, in the past 4 months 472,000 construction jobs have been lost, or about 6% of the total.
  • Residential construction jobs, which are even more leading, rose by 19,100. Even so, in the past 4 months there have still been 45,900 lost jobs, or about 5% of the total.
  • temporary jobs rose by 148,900. Since February, there have still been 696,100 jobs lost, or 24% of all temporary help jobs.
  • the number of people unemployed for 5 weeks or less declined by 1.037 million to 2.838 million, compared with April’s total of 14.283 million. This is similar to the “less awful” readings of the weekly initial jobless claims.
  • Professional and business employment rose by 306,000, which is still 1.830 million, or about 8% below its February peak.

Wages of non-managerial workers
  • Average Hourly Earnings for Production and Nonsupervisory Personnel: declined $0.23 from $24.97 to $24.74, which is still a gain of over 2.6% in 4 months. This reflects that job losses were primarily among lower wage earners, who have been disproportionately recalled to work.

Aggregate hours and wages:
  • the index of aggregate hours worked for non-managerial workers rose by 4.2%. In the past 4 months combined this has nevertheless fallen by about 11%.
  •  the index of aggregate payrolls for non-managerial workers rose by 3.2%. In the past 4 months combined this has nevertheless fallen by about 8%.  

Other significant data:
  • Full time jobs were responsible for 2.418 million of the gains.
  • Part time jobs were responsible for 2.438 million of the gains.
  • The number of job holders who were part time for economic reasons declined by 1,571 million to 9.062 million. This is still an increase since February of 4.744 million.

SUMMARY

The most important fact to know about this report is that it covers the payroll period from May 13 through June 12. During that time initial jobless claims continued to decline strongly, so it was no surprise that this jobs report included a strongly positive headline number.

With only one exception, all of the important internals were also positive. This was a reflection of a broad-based recall to work in many States that “reopened” their economies. Even the decline in average hourly wages was actually a positive, since it reflected lower paid workers being recalled to work.  

The only negative was that the number of permanent job losses increased by over 1/2 million. This tells us that the underlying damage to the economy from the pandemic is spreading out and becoming more long-lasting.

Since June 12 both initial and continuing jobless claims have declined only slightly. More States that recklessly reopened are having to partially shut down businesses like restaurants and bars again. So this report - which shows a total recovery of about 1/3 of the job losses since February - is going to be one of the last hurrahs of the wished-for “V-shaped” recovery from the coronavirus lockdowns. 

Wednesday, July 1, 2020

June data starts out with a bright spot in manufacturing


 - by New Deal democrat

Earlier this week the last of the regional Fed Districts, Dallas, reported their manufacturing indexes for June. The overall picture has been a strong rebound:
Regional Fed New Orders Indexes
(*indicates report this week) 
On a month over month basis, the average is up +36 from -30 to +6
The regional Fed indexes almost always telegraph the direction, and sometimes the amplitude, of the ISM manufacturing index for the entire country. That was certainly the case for June.
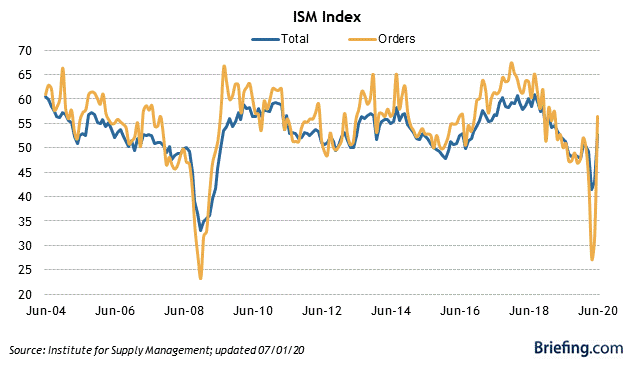
This morning the ISM reported that manufacturing in the US rebounded strongly, up +9.5 from a contracting reading of 43.1 to an expanding reading of 52.6. The even more forward-looking new orders subindex rose from a horrible 31.8 to a strongly expansionary 56.4:
This is good news in an important indicator. Unfortunately, whether it will remain that way in the face of renewed restrictions in States that had recklessly reopened is very much open to question.

Monday, June 29, 2020

Coronavirus dashboard for June 29: renewed exponential growth in infections, decline in deaths has stalled


 - by New Deal democrat

Total US infections: 2,549,069,  42,161 in last day
Total US deaths: 125,803,  273 in last day

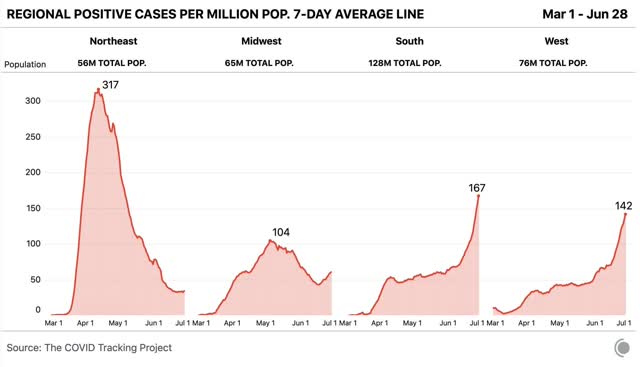
Here is the regional breakdown of the 7 day average of new cases per capita: 


There is renewed exponential growth in the South and West. The Midwest also is beginning to look bad.

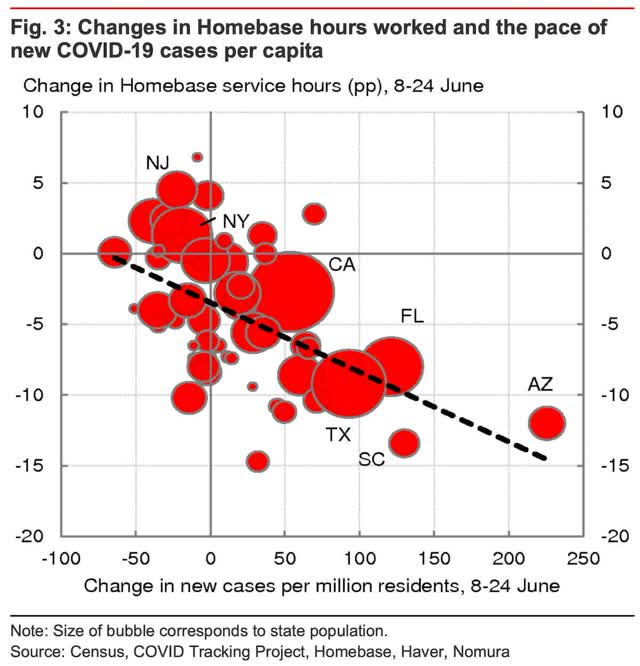
Also, here is some more evidence that, when you recklessly reopen, and the pandemic roars back, customers pull back, thus defeating the entire purpose of “reopening the economy:”


The scientific phrase for this phenomenon is, “Well, duh!”

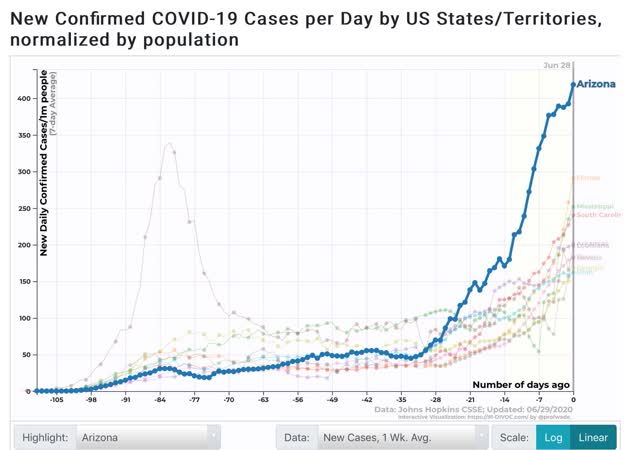
The “top 10” States for new infections per capita are now dominated by the Confederacy, plus Arizona and Utah:


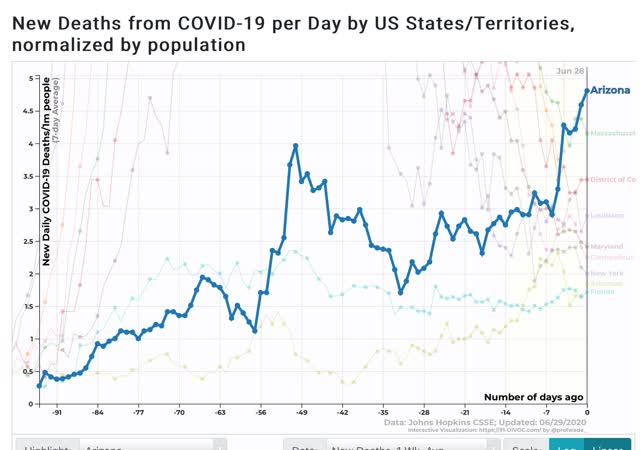
However, while Arizona now heads the “top 10” jurisdictions for deaths per capita, and Louisiana, Arkansas, and Florida have joined the list, the majority is still from the Northeast megalopolis where the death rate, while steeply declining, remains high:


I expect the Northeastern States and DC to drop out of this list over the next 7 to 10 days.

Aside from the situation in the recklessly reopened States, the big issue has been the disconnect between new cases and deaths. The main driver is almost certainly the demographic change from older to younger victims. An important sub-part of that change may be that nursing homes, the “dry tinder” that were first struck by the pandemic, are no longer the epicenter.

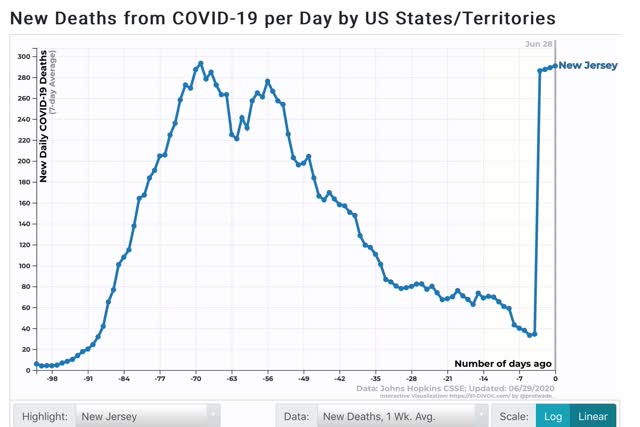
One complication in making sense of the data is that NJ had a big data dump of reassigned death rulings earlier last week:


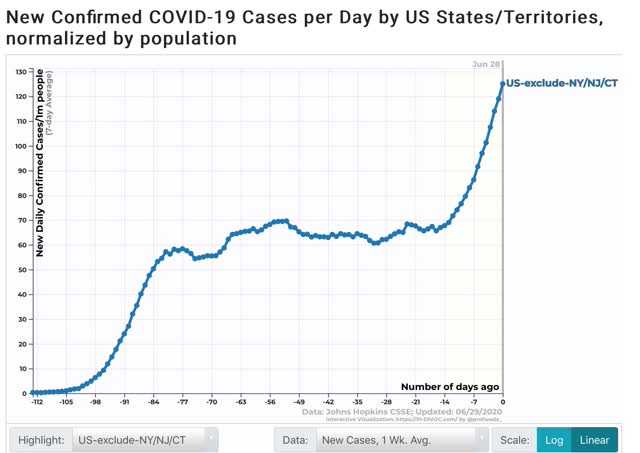
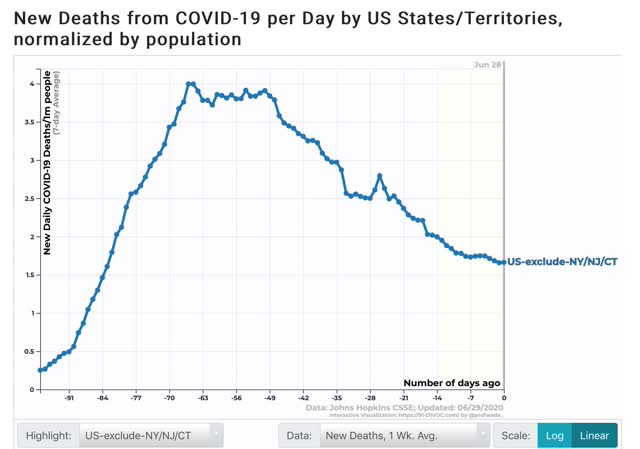
So, the below two graphs take the NYC metro area, including NJ, out of the data, and compare the remaining 47 States plus DC.

Here is the 7 day growth in new cases:


This looks very much like the exponential growth we were seeing back in March.

Now, here is the 7 day change in deaths:


There has been a very slight decline over the past 10 days of the 7 day average.

The change in trajectory of deaths happened roughly one week after the new exponential growth in infections started. Because the young are not totally invulnerable from dying of the disease, I expect the death rate to slowly start rising, pretty much imminently.

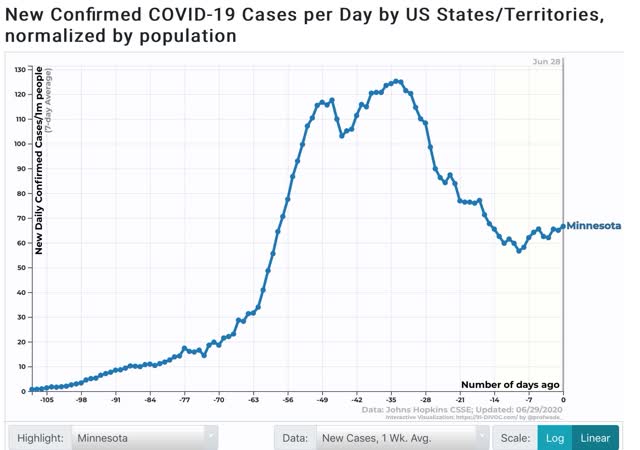
One final note. How much did the Black Lives Matter protests affect new cases? Obviously social distancing went out the window, but the protests were outdoors and by all accounts almost all of the protesters wore masks. Since the protests started in Minnesota on May 25, 35 days ago, the effects ought to be apparent in cases by now.

So here is what Minnesota looks like:


New infections continued to decline for 25 days, but have risen slightly in the past 10 days. This suggests, thankfully, that the protests will have little effect on the trajectory of new cases.

Sunday, June 28, 2020

The US Presidential election as forecast by State polling: tending towards a Biden blowout?


 - by New Deal democrat

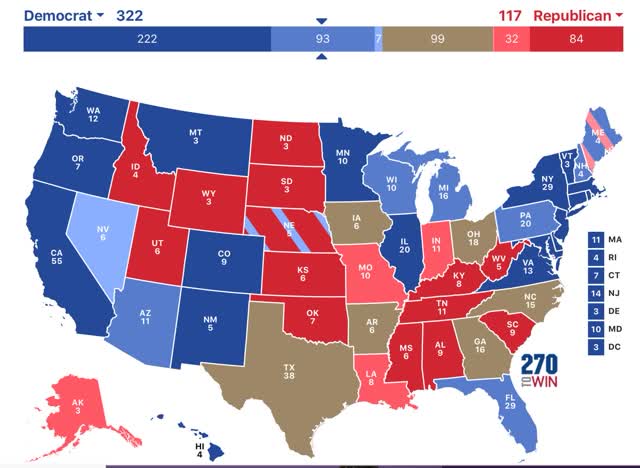
Last week I posted a projection of the Electoral College vote based solely on State rather than national polls (since after all that is how the College operates) that have been reported in the last 30 days. There has been extensive polling in the past week, so I have updated the map.

Here’s how it works:
- States where the race is closer than 3% are shown as toss-ups.
- States where the range is between 3% to 5% are light colors.
- States where the range is between 5% and 10% are medium colors.
- States where the candidate is leading by 10% plus are dark colors.

Here is the updated map:


The most important change since last week is that we got extensive polling for Pennsylvania, that moves that State from toss-up into likely Biden. Florida and Minnesota both moved one category more firmly into Biden territory.

Even though I certainly expect some of the Confederate States, like Texas and Arkansas, to return to the Trump fold, as of now, if Biden were simply win the States in which he leads by 5% or more in the polling, he would win the Electoral College, without even winning a single “toss-up” or “lean Biden” State as shown on the map.

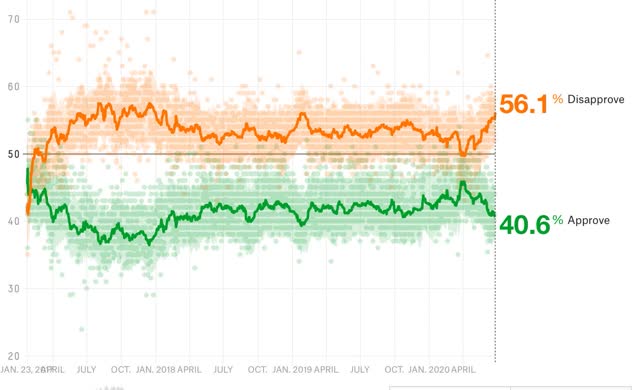
Last week I noted that Trump always polls his worst when he appears both cruel and clueless. Let me illustrate that using Nate Silver’s graph of Trump approval and disapproval:


Trump polled his best during the impeachment and immediately after, when he briefly seemed to take the coronavirus seriously; the “rally round the flag” effect. Conversely, his worst approvals have come at four times:
     (1) late 2017, when he tried - and failed - to repeal Obamacare. That was cruel, and he failed at it.
     (2) summer 2018, during the “kids in cages” publicity. It was intentionally and especially cruel, and again, it didn’t even “solve the problem” from the RW point of view.
     (3) the government shutdown of January 2019. Again, it was cruel, and he failed.
     (4) the coronavirus pandemic now. Trump basically wants old people to go ahead and die now so that the economy can recover in time for the election. Again, cruel - and it isn’t working anyway. And on top of that, he is advocating for police brutality and Confederate statues - two other issues on which the majority is firmly on the other side.

Trump has totally backed himself into a corner where the pandemic is concerned. He can’t suddenly start taking it seriously again. After all, that would be admitting that he was wrong before. And the pandemic will not be controlled in the next several months, which means the economy is not going to meaningfully improve. Indeed, in the recklessly reopened States, where businesses will likely have to close again, it is probably going to get worse. And some of these are swing States.

Finally, Biden is a well-known politician. He isn’t a newcomer like Dukakis who can be defined by a few devastating ads. While Trump’s standing may revert towards his mean, I just don’t see a big improvement from here. If anything, I think it is more likely that more of his fans abandon him as they sense that he will lose, and the US election moves towards a Biden blowout.

Saturday, June 27, 2020

Coronavirus dashboard for June 27: infections -> hospitalizations -> deaths


 - by New Deal democrat

Total US infections: 2,480,786,  44,373 new cases
Total US deaths: 125,120,  619 new deaths

A quandary over the past month has been why deaths declined so much more than new cases, while cases were declining; and more recently why deaths have continued to decline in the face of soaring new infections.

Is it because of better treatments? Changing demographics - e.g., fewer nursing home cases, more younger people? Or is something more even more fundamental with the nature of the virus itself going on? In short, should we expect deaths to continue to decline, or to turn up following the increase in new infections?

I am expecting deaths to begin to rise again, imminently.

Here’s why: the progression is:
- first, infections increase/decrease
-second, hospitalizations increase/decrease
-finally, deaths increase/decrease.

The problem in the US data has been that hospitalizations have been missing from almost all compilations. That’s because not all States - and most especially, Florida - track hospitalizations.

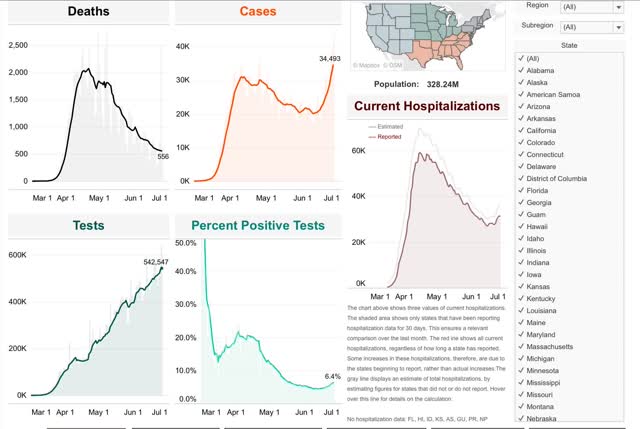
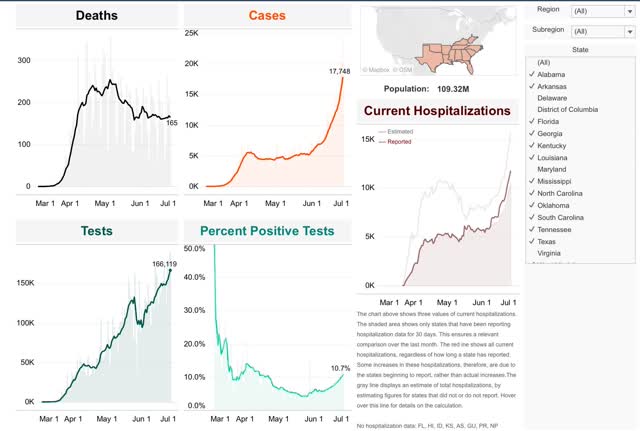
Conor Kelly, however, *does* track reported hospitalizations from all States which have reported for at least 30 days, which totals roughly 40 States. So if deaths are going to start to increase again, it should first appear in this data. Further, if this is because of the reckless reopening of some States, it should most plainly appear in those regions. With that in mind, here is the data.

Total US hospitalizations bottomed on June 14 at 26,441. In the 12 days since, they have risen by almost 14% to 30,065:


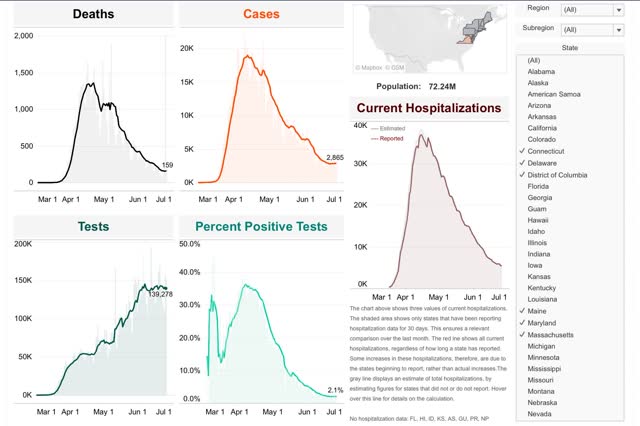
One benefit of Conor Kelly’s compilation is that it allows users to generate customized regions of States. So, for example, here is the data for the East Coast megalopolis from Maine through Virginia:


Cases have risen very slightly in the past few days, while hospitalizations have continued to fall. Deaths have flattened.

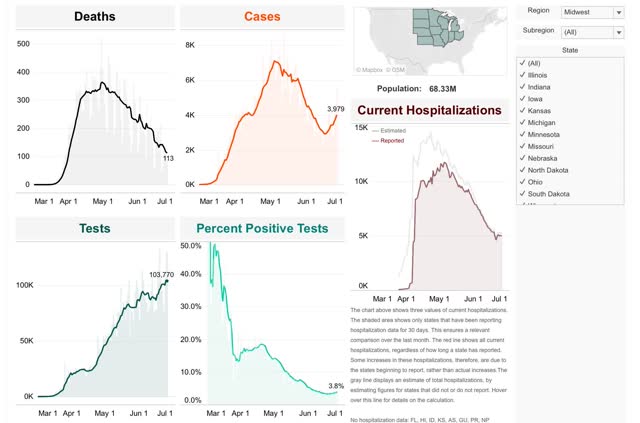
In the Midwest, cases have risen by about 25% in the past 12 days. Hospitalizations have flattened, while deaths have continued to decline:


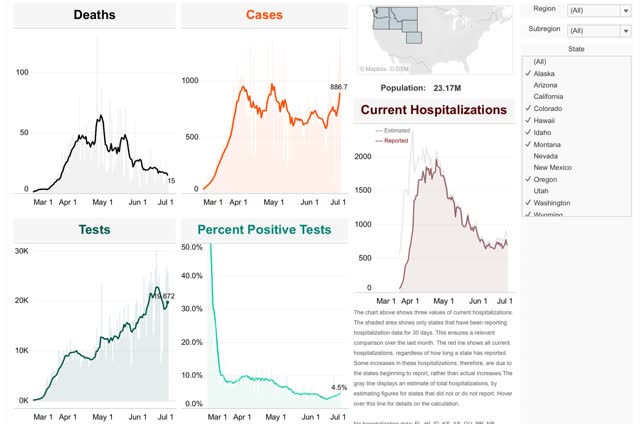
In the northern West, case started rising a month ago, after May 26. Hospitalizations bottomed two weeks later on June 7. Deaths started to creep up at the same time:


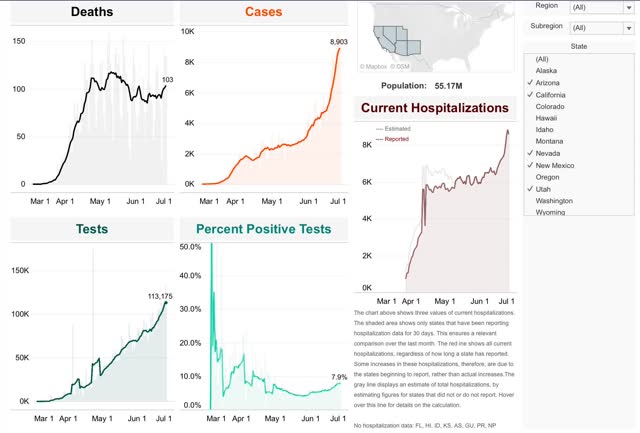
In the Southwest, cases never decreased. But there was an inflection point for increased cases on May 28, which had 3,528 new cases. By June 26, that had more than doubled to 8,758 new cases:


The inflection point in hospitalizations followed on June 14, since which time the number has increased by over 35%. The upward inflection in deaths followed on June 20.

Finally, in the Deep South, cases actually bottomed on April 27 at 4,337, with an upward inflection point at May 27, on which there were 5,171 new cases. Since then new cases have more than tripled to 17,748:


Hospitalizations reached their inflection point on June 6 at 5,791. Since then they have nearly doubled to 10,565. Deaths bottomed on June 18 at 160 and have risen slightly since then to 165.

In short, while there is considerable variation, in general deaths have lagged hospitalizations by about 1 to 2 weeks. We are now nearly 2 weeks after the bottom in hospitalizations for the US as a whole. Thus I expect deaths to start increasing, at least slowly, in the next few days.

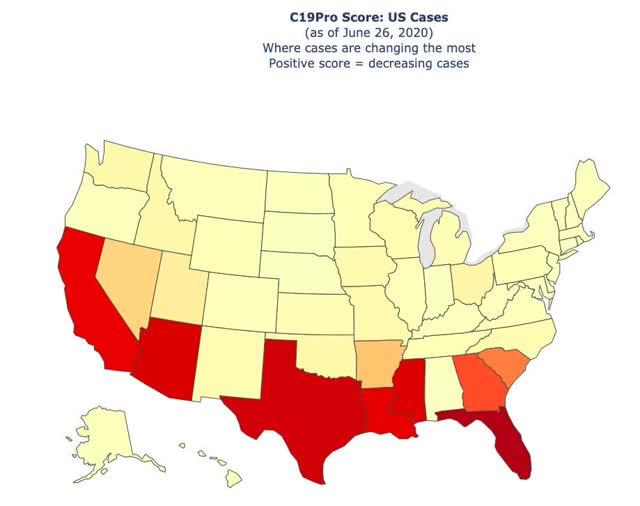
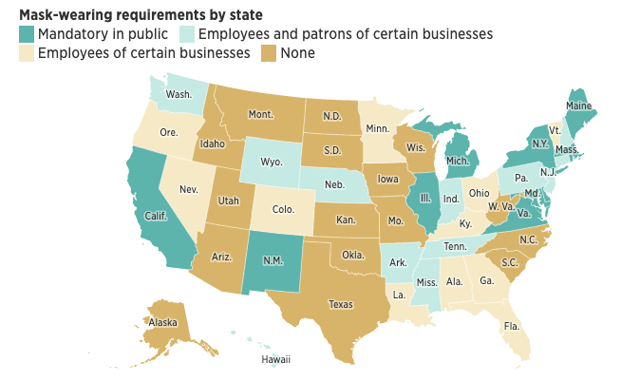
Turning to some of the drivers of the increase in cases, here are two charts. The first is a chart of which State have increasing (red and orange) vs. decreasing (yellow) cases in the past week; the second is a chart of mask-wearing regulations by States:


With the very notable exception of California on the one hand, and the sparsely populated States of the northern Plains and Rockies, mask-wearing, or the lack thereof, is highly correlated with increases or decreases in new cases.

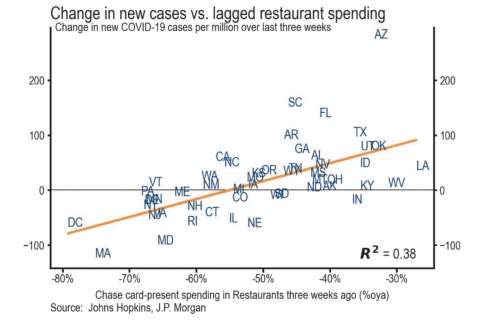
Another big correlation with new cases has been restaurant reopening, as shown in the below graph comparing cases with restaurant spending:


Confined indoor spaces, air-conditioned recirculating ventilation, and the necessary lack of mask-wearing in order to eat or drink sure seems to be a recipe for spreading the virus.

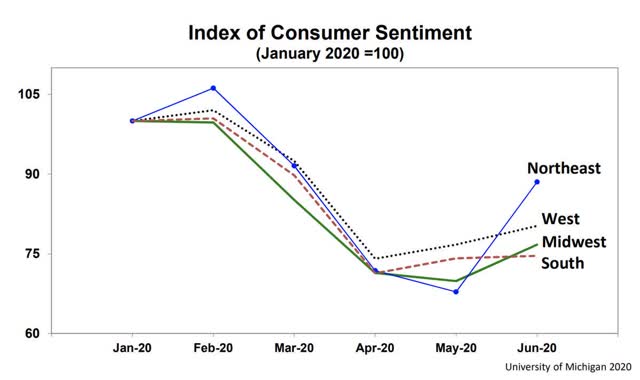
And if the public does not have confidence that the virus has been contained, the economy is not going to be able to sustain reopening for very long, as shown in the below graph of consumer confidence by region:


Only in the Northeast, where the virus has been very well contained (for now) has there been a big rebound in consumer confidence.
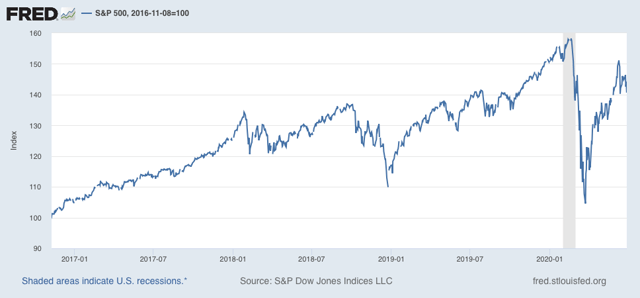
Finally, it’s worth noting that this is even showing up in the stock market:


As of Friday, the S&P 500 was less than 5% above where it was at its January 2018 peak. If deaths start to rise substantially, as I believe they will, portions of the economy are going to shut right back down again, whether by law or regulation, or simply because customers stop showing up. 

Weekly Indicators for June 22 - 26 at Seeking Alpha


 - by New Deal democrat

My Weekly Indicators post is up at Seeking Alpha. The coincident indicators, as well as the short leading indicators, have continued to improve gradually each week.

But this week may be the near term peak, as the reality of renewed exponential spread of the coronavirus in recklessly reopened States starts to hit home. You cannot force people to patronize businesses if they believe it is unsafe, and when complacency leads to new outbreaks, the pain threshold will be hit at which people pull back again. Most noteworthy is that restaurant reservations did not improve in the past week - people are shying away from danger.

As usual, clicking over and reading rewards me with a little jingle in my pocket as well as bringing you right up to date with what is happening in the economy.

P.S.: I plan on putting up an extra coronavirus update later today. Stay tuned.

Friday, June 26, 2020

All 4 coincident indicators of recession improved in May vs. April


 - by New Deal democrat

With this morning’s release of personal income and spending, we now have all 4 coincident indicators for May that the NBER uses to determine whether the economy is in recession or recovery/expansion. And all 4 improved from their “most horrible” readings in April.

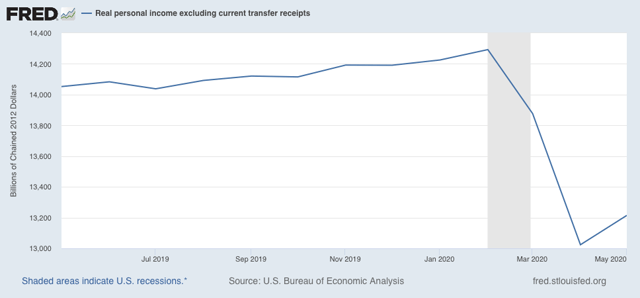
A recession is a generalized downturn in production, employment, sales, and income. The “income” metric that the NBER uses is “real personal income excluding current transfer receipts,” (basically, government program payments to individuals) and as shown in the graph below, it improved from April: 


Still a horrible decline from February, but “less horrible” compared to April.

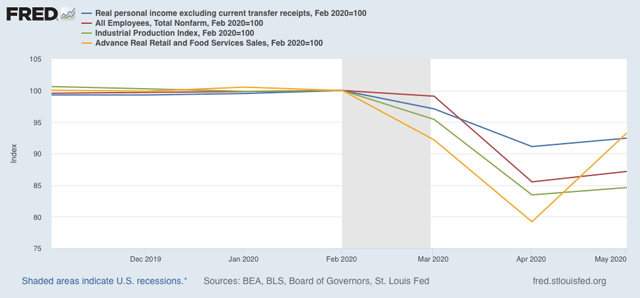
Since industrial production, nonfarm payrolls, and real retail sales also all improved in May from April, that makes it 4 for 4 among the coincident indicators:


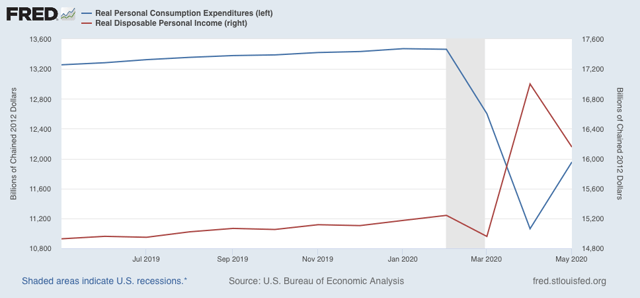
Real disposable personal income (red in the graph below) declined in May from April, but was well ahead of previous months. This probably represents the delayed receipt and cashing of some of the one-time $1200 stimulus checks distributed by Congressional Act. Real consumption expenditures (blue), however, increased significantly, probably reflecting in part spending of that stimulus money by consumers, and partly spending by those called back to work:


In short, in May the situation was still horrible, but “less horrible” than April. That would qualify for the beginning of a recovery by economists’ definitions, *provided* there is no renewed downturn. And as the coronavirus continues to wreak more havoc in the States that have recklessly reopened - or simply let their guards down - a renewed downturn is very much a possibility, and almost a certainty if Congress does not extend the enhanced unemployment program by the end of July.

Thursday, June 25, 2020

Initial jobless claims improve slightly; continuing claims resume decline


 - by New Deal democrat

Weekly initial and continuing jobless claims give us the most up-to-date  snapshot of the continuing  economic impacts of the coronavirus on employment. More than three full months after the initial shock, the overall damage remains huge, with large spreading new secondary impacts. The positive news is that the total number of claims, including continuing claims, has resumed being “less awful,” likely meaning more people have been recalled to their jobs than have newly lost them.

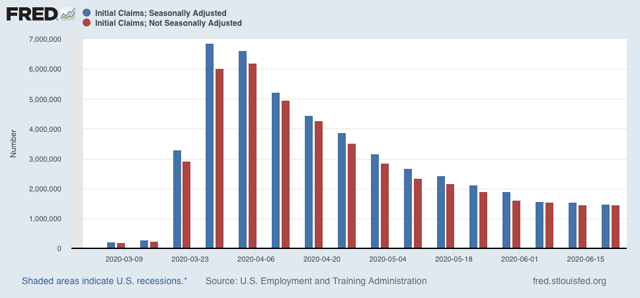
First, here are initial jobless claims both seasonally adjusted (blue) and non- seasonally adjusted (red). The non-seasonally adjusted number is of added importance since seasonal adjustments should not have more than a trivial effect on the huge real numbers:


There were 1.457 million new claims, only 6,000 less than one week ago. After seasonal adjustment this became 1.480 million, “only” 60,000 less than last week’s number. While the trend of the past 45 days of slight declines in new claims continues, this is the smallest weekly decline since the worst reading in April. Further, this objectively continues to show huge second-order impacts continuing to spread.

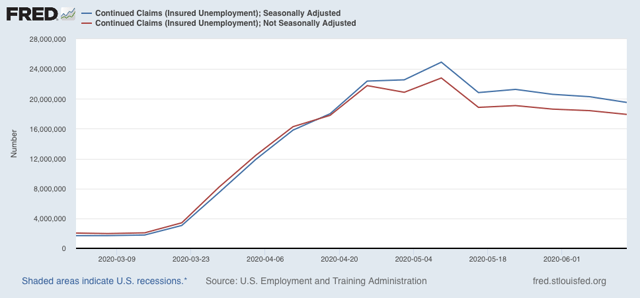
Meanwhile, after several weeks of no significant change, the “less bad” trend in continuing claims, which lag one week behind, has reappeared. In the previous four weeks, both the non-seasonally adjusted number (red), and the less important seasonally adjusted number (blue) had remained nearly stationary. This week the former declined by to 17,921 million, 4.873 million below its peak of 24.912 million five weeks ago; while the latter  declined by 767,000 to 19.522 million, 5.390 million below its peak of 24.912 million reading five weeks ago:


In other words, the spreading new damage shown by the continued huge numbers of new jobless claims is about equal to the callbacks to work from various sectors “reopening.”

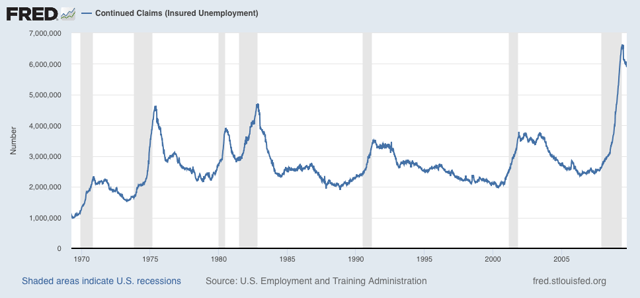
Historically initial claims have peaked several months before the end of recessions, and  continuing claims have peaked at the end of or just after the end of recessions. Here’s the graph of continuing claims showing that from the beginning of the series through 2009:


For the moment at least, this indicates that the economy - and the jobs market - was at its “most awful” in late April or early May, and has gotten “less awful” since. Thus we should expect another positive number in the June jobs report that will be released one week from today.
But because there is now overwhelming evidence of renewed exponential spread by the coronavirus in States that recklessly reopened, all of the improving economic data may come to an abrupt end in the next few weeks. For example, although he has stopped short of an order, even Texas’s Trumpist governor has now recommended that people voluntarily “shelter in place” again.

Wednesday, June 24, 2020

Housing rebounded sharply in May


 - by New Deal democrat

One aspect of the economy that is important in terms of how well things will go once the pandemic ultimately recedes (which won’t occur until after next January 20) remains housing.

And low interest rates brought housing back from the depths in May.

My look at the current state of mortgage rates, housing sales, and prices is up over at Seeking Alpha.


Tuesday, June 23, 2020

Coronavirus dashboard for June 23: focusing on deaths, and the Trumpist South and Southwest


 - by New Deal democrat

Confirmed total US infections: 2,312,302. (+31,433 in past 24 hours)
Confirmed total US deaths: 120,402 (+425 in past 24 hours)

We know that new cases are accelerating again. Is it translating into an increase in deaths? The answer appears to be: not yet, but getting close.

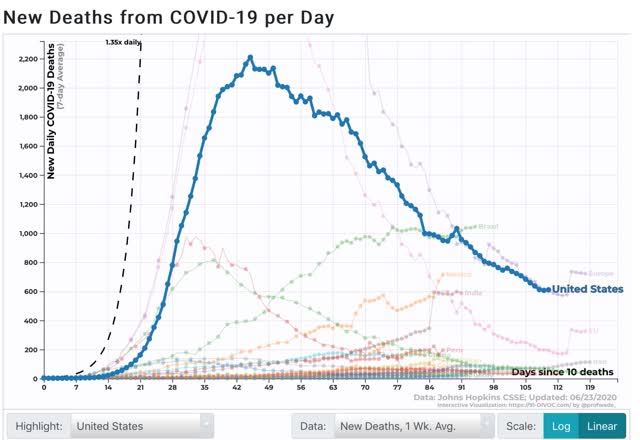
Here is the 7 day average of new deaths in the US: 


In the past 3 days, the decline has ceased at roughly 610/day.

A regional look shows that the decline in new deaths has stopped everywhere except in the Northeast.

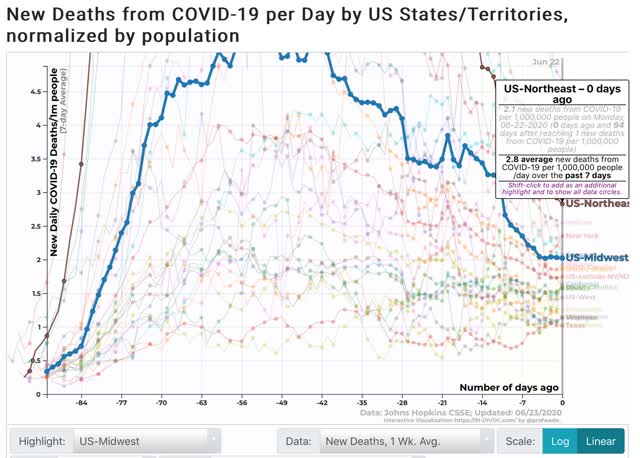
The first graph shows the 7 day average of deaths in the Northeast and Midwest; the second the South and West:


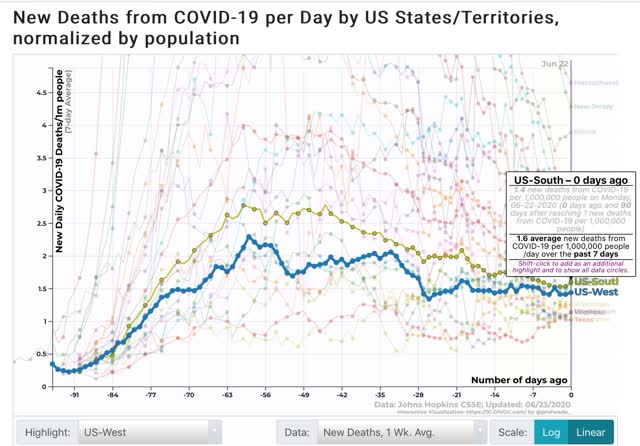
The Northeast still has the highest death rate per capita, at 2.8 deaths per day per million, with the Midwest at 2, the South at 1.6, and the West at 1.4. But the trend in the South and West has been flat for the past week, and the Midwest for the past few days. Only in the Northeast has the rate continued to decline sharply, masking the ominous trends in the other regions.

Finally, here are the 10 highest jurisdictions by 7 day average in death rates per capita:


Since the graph doesn’t show trends that well, here is the list, including whether the rate has been rising, falling, or flat over the past 7 days:

RI 7.0 (declining)
MA 4.6 (declining)
NJ 4.3 (declining)
MS 4.0 (declining)*but new high yesterday
DC 4.0 (flat)
IL 3.9 (declining)
MD 3.0 (declining)
LA 3.0 (flat)
AZ 2.9 (increasing)
IN 2.5 (flat)

The list remains dominated by States in the Northeast, plus Illinois, where the rate of deaths has continued to fall. Three States where cases have been increasing (Mississippi, Louisiana, and Arizona) have joined the list with rising death rates.

I expect this transition to continue. I expect US death rates as a whole to begin to climb in the next few days, and for States in the South and West to replace States in the Northeast over the next 10 days. Very discouraging.

The question now is, are Trumpist GOP States subject to the same pain threshold that others were earlier? I think they are, but they will arrive there kicking and screaming, and ready to relax again at the very first opportunity.

Monday, June 22, 2020

Coronavirus dashboard for June 22: a pandemic newly focused on the young appears to be changing the dynamics


 - by New Deal democrat

Confirmed US coronavirus infections: 2,280,969
Confirmed US coronavirus deaths: 119,977

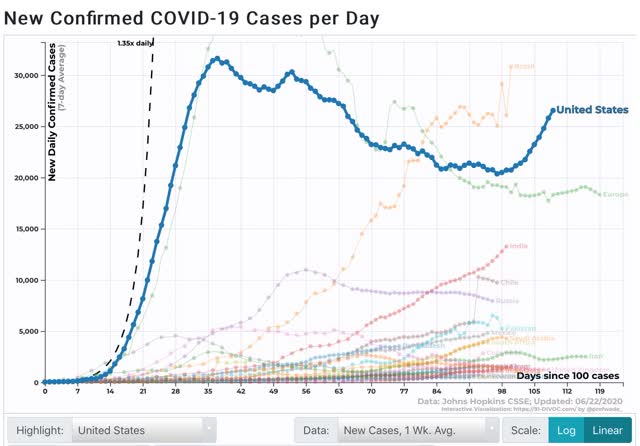
The 7 day average of new infections in the US has risen 30% from its low of 20,357 on June 9 to 26,546 yesterday:


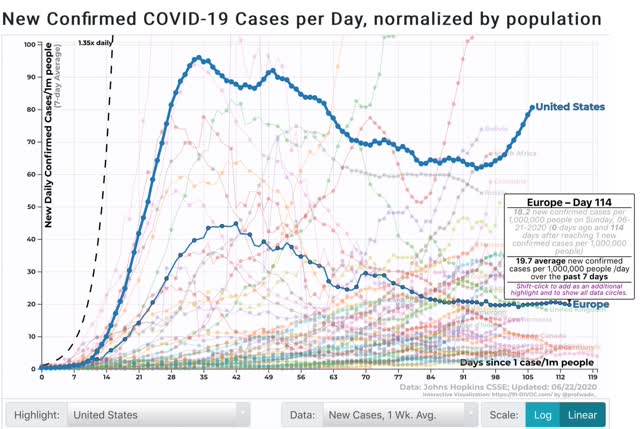
On a per capita basis, US infections are now roughly 4x those in Europe:


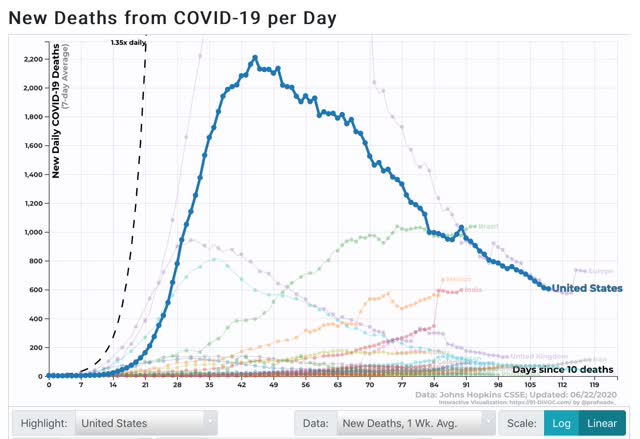
Curiously, the 7 day average of deaths has continued to decline, to 605 as of yesterday: 


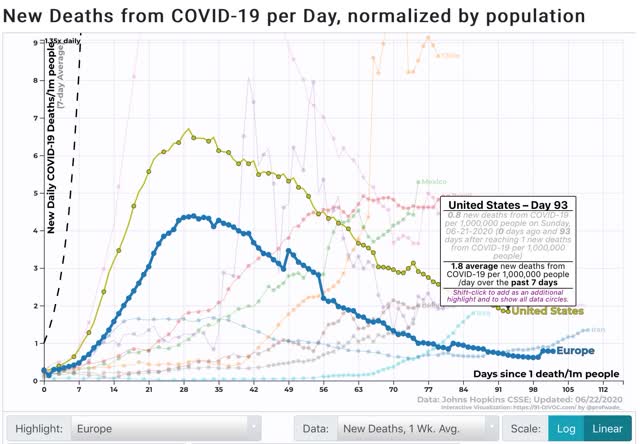
On a per capita basis, US deaths from coronavirus are only 2x those in Europe:


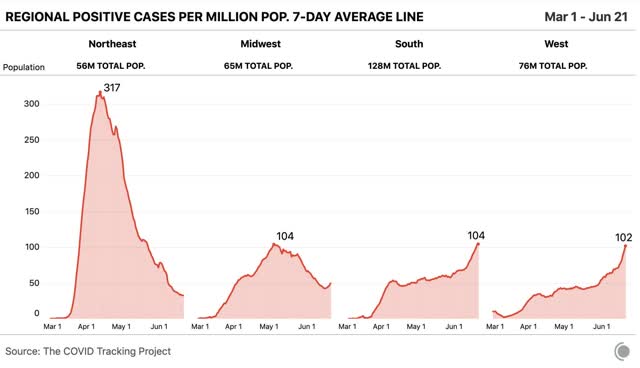
Within the US, the per capita rate of infections has continued to fall in the Northeast megalopolis, risen slightly in the Midwest, but is rising at what may be exponential rates in the South and West:


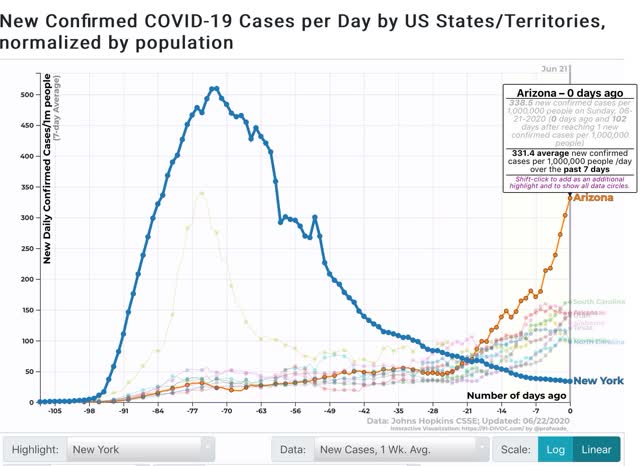
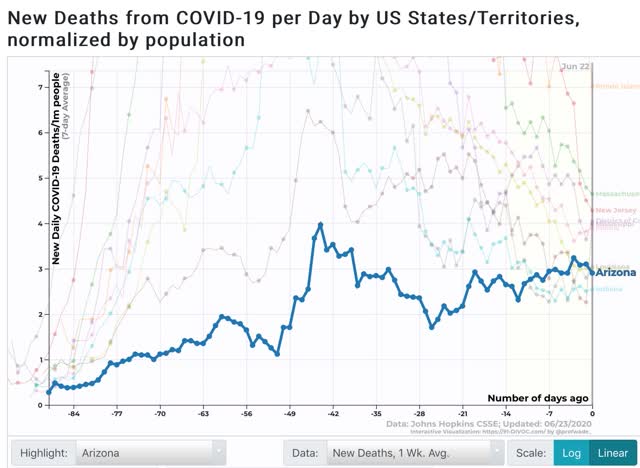
The poster child for confirmed new exponential spread remains Arizona, which now has a rate of new infections 2/3’s that of NY at its peak, and is likely to match that within a week:

 
The remaining “top 10” for new infections per capita are all from the Confederacy, plus Utah - and they are also all rising, in the 100 to 160 new cases per million per day range.

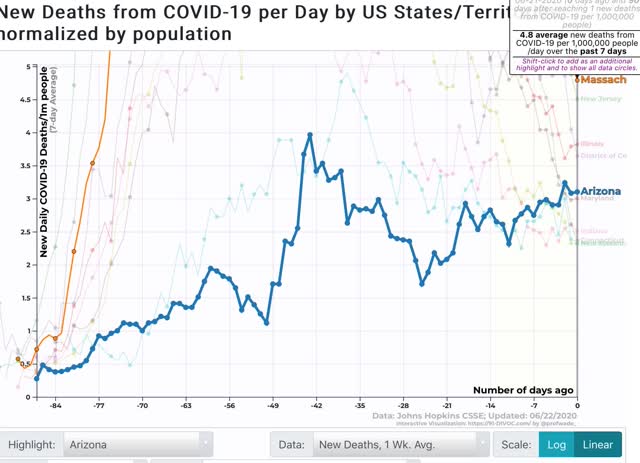
When it comes to deaths, however, the “top 10” are almost all from the Northeast megalopolis, led by Massachusetts, but they are in serious decline:


Only Arizona from the new outbreaks has risen into the “top 10” for deaths.

The continued decline in new deaths may just be a lag in the data, but there are several other possibilities as well:
- better hospital treatment
- shutting down nursing home spread (since nursing homes were responsible for over 1/3 of all deaths in the first several months of the pandemic.

Perhaps most significantly, the paradox may be explained by the average *age* of those newly infected. The evidence is, it has dropped precipitously. 

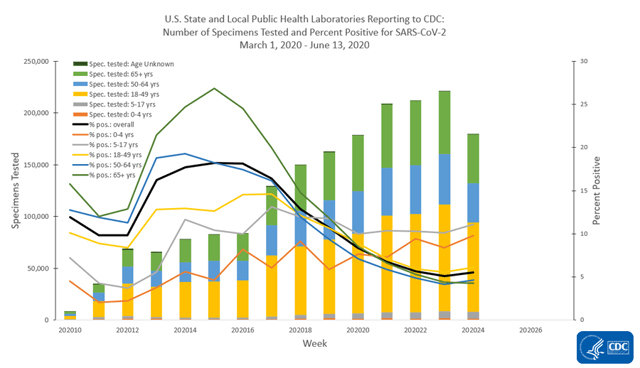
Unfortunately, I failed to copy the graph I saw of the total US statistic for that measure, but here is an age-breakdown for US testing and % positive:


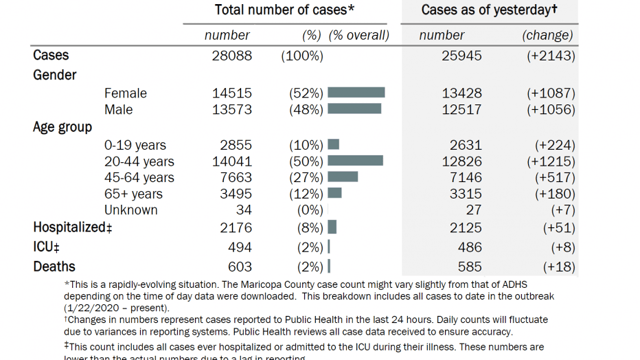
Those in age group 18-49 years saw a much bigger increase in tests administered, and less of a decline in the % positive - meaning a higher rate of diagnosed infections in that age group.

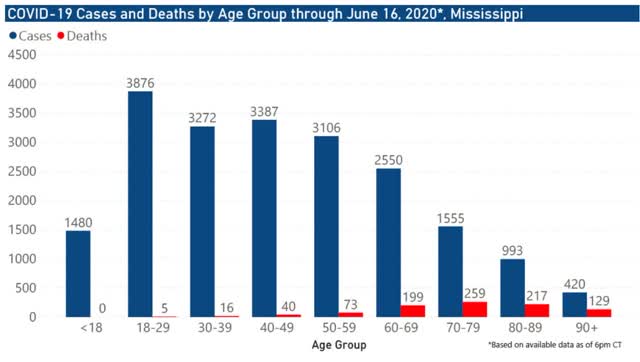
Here is the age breakdown for Mississippi:


And here is a chart of the age breakdown for Maricopa County, Arizona:


Officials in states across the South and Southwest are reporting that an increasing share of coronavirus cases are among the young.
The shifts in demographics have been recorded in parts of Florida, South Carolina, Georgia, Texas and other states -- many of which were some of the first to reopen.And while some officials have pointed to more widespread testing being done, others say the new cases stem from Americans failing to social distance. 
In Mississippi, where one health officer called adherence to social distancing over the past weeks "overwhelmingly disappointing," officials attributed clusters of new cases to fraternity rush parties. 
Texas Gov. Greg Abbott said last week that people under 30 made up a majority of new coronavirus cases in several counties. He said that increase in young infected people could be related to Memorial Day parties, visits to bars or other gatherings. 
And in Florida, Gov. Ron DeSantis said Friday that the median age was 37 for newly diagnosed coronavirus cases over the last week. In the state, 62% of new cases for the week of June 7 are under 45 years old, he said. 
"That is a big change from where we were at the end of March and the beginning of April. It was skewing much older at that time," he said.
Similar news has been reported from California:
As California’s economy opens up, coronavirus cases are getting younger and younger.An analysis released this week reveals that more than 44% of new diagnoses are in people age 34 or younger, up from 29% a month ago. 
There’s a corresponding drop in cases among older people. The proportion of COVID-19 cases among Californians older than 50 has plummeted from 46% to 30.5% in the past month. 
The proportion of cases among middle-aged Californians — ages 35 to 49 — has plateaued, neither rising nor falling. 
“It is striking that there is such a strong shift. Cases are much younger now than they were earlier in the pandemic,” said infectious disease epidemiologist George Lemp, who calculated the trends using historical data from the California Department of Public Health. 
“It may reflect the opening up of California since mid-May, particularly among younger people who may have started to move away from the practices of social distancing and consistent mask use,” he said.
It appears that the de facto US policy is to allow the virus to run through the younger population, while the older part of the population voluntarily continues to self-quarantine. Even with a low fatality rate like 0.2% among the younger demographic, that would translate into roughly 300,000 deaths among that group alone. 
My take has been that the US simply lacks the political and social will to take the necessary steps to effectively contain the virus. Arizona is going to be the canary in the coal mine for whether States with Trumpist governors and GOP legislatures will ever be scared into action, and we should get that answer within the next 2 weeks.

Sunday, June 21, 2020

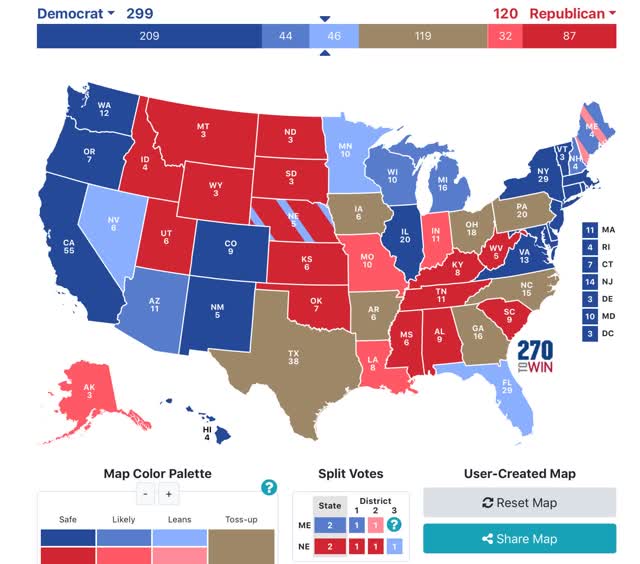
The 2020 Presidential election as forecast by State polling


 - by New Deal democrat

As we all know, in the US Presidential election national polls are of limited use, as the election is actually decided on a State by State basis.

I’ve seen lots of projections of the Electoral College vote based on national polls, but what if we go just by State polls, and in particular State polls that have been reported in the last 30 days?

That, dear reader, is what the following map looks like:


I prepared this map after a slew of State polling was reported on Wednesday. Here’s how it works:
 - States where the race is closer than 3% are shown as toss-ups.
 - States where the range is between 3% to 5% are light colors.
 - States where the range is between 5% and 10% are medium colors.
 - States where the candidate is leading by 10% plus are dark colors.

The only change since Wednesday is that there was a Minnesota poll that gave Biden a 16% lead, enough to bring the average for that State over 10% in favor of Biden.

As of now, all Biden has to do is win the States in which he leads by 3% or more in the polling, and he wins the Electoral College, even without winning a single “toss-up” State as shown on the map.

The only surprising negative for Biden is that Pennsylvania remains a toss-up. Surprisingly, little polling has been done in that State, but while Biden has a slim lead on average, there are several polls dating from May that show a slight Trump lead.

I expect some of the Confederate States to return to the Trump fold.  He always polls his worst when he appears both cruel and clueless. And that’s exactly what he has appeared between his actions on both COVID-19 and Black Lives Matter. His stands are unpopular, and his P.R. stunts (most notably the photo-op at the church) simultaneously have looked tin-eared and execrable.