Tuesday, May 1, 2012

Housing prices: a rebuttal to Barry Ritholtz, part 1


   - by New Deal democrat

The big housing debate is whether prices are on the cusp of bottoming (or possibly, already have) vs. whether there is a considerable ways still to go before housing prices bottom.

Two of the most popular bloggers, Bill McBride a/k/a Calculated Risk, and Barry Ritholtz, are on opposite sides.

Back on February 6, CR said:
There are several reasons I think that house prices are close to a bottom. First prices are close to normal looking at the price-to-rent ratio and real prices (especially if prices fall another 4% to 5% NSA between the November Case-Shiller report and the March report). Second the large decline in listed inventory means less downward pressure on house prices, and third, I think that several policy initiatives will lessen the pressure from distressed sales (the probable mortgage settlement, the HARP refinance program, and more).

....[T]his doesn't mean prices will increase significantly any time soon. Usually towards the end of a housing bust, nominal prices mostly move sideways for a few years, and real prices (adjusted for inflation) could even decline for another 2 or 3 years.
Barry Ritholtz responded with a 5 part series, in which he concluded:
homes will continue stumbling along the bottom of the price range, with a negative bias to prices. Another 5-10% is a very easy downside target — assuming nothing else goes wrong.
CR's style is inductive: he looks at past patterns, such as months of housing supply on the market, notices that the same patterns are in evidence now, and concludes we are near a bottom.   By contrast, Ritholtz's piece is more deductive.  Certain factors, since as a large number of foreclosures, are hanging over the market.  It is logical that these will cause prices to fall further, therefore they will. 

It will hardly surprise anybody who has been reading my housing posts for the last year that I believe housing is close to making a "nominal" bottom (i.e., without adjusting for inflation).  My arguments and conclusions are close to CR's.

Nevertheless, Barry Ritholtz has written a comprehensive and intelligent defense of his position.  Since I respectfully disagree, it is fair that I point out why his arguments ultimately fail to convince me.

Ritholtz's arguments can be distilled into three:  (1) housing is not actually affordable by traditional measuresDown payments remain unrealistically high, and buyers cannot qualify for mortgages; (2) there is a large overhang of "shadow inventory" most especially including but not limited to foreclosures, which are primed to put renewed downward pressure on prices; and (3) potential buyers, especially younger buyers, are fearful of the potential immobility that comes with owning a house vs. renting.

My rebuttal, in order, is in summary that:  as to point (1) Barry's argument regarding traditional housing affordability fails to account for the role of mortgage rates. Once we take those into account, housing is already fairly priced. Beyond that, his argument about what potential homeowners can afford contains a vital mathematical error.  As to point (2) the rate at which foreclosures and other shadow inventory come on the market makes a world of difference as to whether they affect the first derivative of prices (i.e., the direction), or only the second derivative (e.g, rather the rate of increase is faster or slower).  At times Barry's own stated argument is as to the second derivative rather than the first.  Finally, as to point (3) demographics are destiny.  Not only is there "pent-up demand" of young buyers who so far have been unable to buy a home, but there is an ongoing increase in the number of young adults at the age when the purchase of a first home takes place.  This is an increase in demand that will overwhelm the contrary factors.

One final point:  much like the argument as to the overall economy, much of the vehemence is semantic.  CR says that the housing recovery has begun.  Ritholtz says his intent is debunking the housing recovery story.  Despite this, CR and Ritholtz are really not far apart.  Like me, CR believes prices are making a "nominal" bottom and in real terms they will continue to decline.  Ritholtz sees at minimum another 5% to 10% decline, with prices "stumbling along the bottom of the price range."   Those two conclusions aren't necessarily inconsistent, depending on whether part of Ritholtz's decline includes nominal prices.

Next: Housing affordability

John Hussman's recession index just blew up


  - by New Deal democrat

In early February I wrote that John Hussman's recession warning criteria had been invalidated. Oversimplifying somewhat, Hussman's 4 criteria were: (1) credit spreads wider than 6 months before; (2) the S&P 500 lower than 6 months before; (3) the ISM manufacturing index under 54 simultaneously with less than 1.3% YoY employment growth; and (4) a yield curve of less than 2.5%. In closing, I said that Hussman should at least explain why he believed his recession call was still valid. Put another way, what is the "off" switch for the above criteria, if it is different from the "on" switch?

The next week Hussman spent part of his weekly market comment defending that call. His defense rested, as I understand it, on two grounds: (1) one or more criteria was violated in 2008 and the recession warning, obviously, was still valid; and (2) there is no "off" switch for the criteria, but rather, once "on," a cornucopia of bearish evidence may be invoked, and entirely different criteria, e.g., a positive ECRI growth WLI, signals the end of recession.

Well, Hussman's recession criteria just blew up. This morning the ISM manufacturing index came in at 54.8. YoY employment growth is about +1.5%. The stock market is higher than it was 6 months ago. Credit spreads between corporate bonds and 3 month treasuries are lower than they were 6 months ago. Every single one of Hussman's recession warning criteria is now invalidated, with the sole exception of the yield curve being less than 2.5% (which it was for several decades near the mid 20th century, and probably will be again now). In the past this has only happened once the economy moved out of recession into recovery.

The icing on the cake is that the "all clear" signal that Hussman said he would recognize -- the ECRI WLI growth index turning positive -- has also come into existence for the last 3 weeks. I really don't see any wiggle room left. Under the terms he himself set, Hussman's recession index says we are in expansion.

Morning Market Analysis

Yesterday, I noted that I believe the markets are moving into a period of consolidation, largely because equities have fallen from highs will treasuries have rallied.  Today, I want to add to that thesis.


Oil has been trading around the 102 level for the last month.  While it has rallied a bit lately, it's still below highs.  Also note that EMAs are very tightly bundled, giving us no real direction.  However, some of the underlying technicals (MACD, A/D and CMF) are starting to show bullish signs.  But, until we see this follow-through in prices, the chart isn't that exciting.  Here, prices have to move close to the 110 level to indicate we're away from the bearish sentiment.


Industrial metals have rallied this last week.  But prices are still below the 200 day EMA, and are still below the 61.8% Fib level.  Prices need to move through the 21.75 level to indicate there's been a meaningful change of sentiment.

The Chinese market -- which broke the downtrend started at the end of February -- is in an upward sloping channel.  But prices are still at important Fib levels, while the EMAs are tightly bunched.  There are some good underlying technical developments, but they have not followed through in prices yet.


The Brazilian market continues to move lower.  Prices are now right below important Fibonacci levels, while the EMAs are very bearishly aligned -- all are moving lower and the shorter are below the longer.  The volume indicators are also bearish -- money is flowing out of the market.


The Russian market is similar to the Brazilian market, although the EMA picture is not as dire.  In addition, the MACD has given a buy signal -- although the indicator itself is still in negative territory.


Monday, April 30, 2012

Bonddad Linkfest

  1. Romney's path to victory (WaPo)
  2. EU inflation at 2.6% (BB)
  3. German retail turnover at .8% in April (FSO)
  4. German retail sales don't bode well for GDP (Marketwatch)
  5. Europe's growth challenge (WaPo)
  6. Soy Bean Prices Soaring, leading to food inflation fears (FT)
  7. US industrial slowdown may by on the horizon (FT)
  8. China's appetite for cereals lifts corn prices (FT)
  9. Spain's economy contracts for second quarter (Marketwatch)
  10. EU private lending slows in March (Marketwatch)

A Closer Look At the GDP Report

Let's take a deeper look at the latest GDP report, starting with the percentage change in GDP and the contribution of various components to this number.


First, we see that personal consumption expenditures (PCEs) added 2.2 to GDP -- or, put another way, PCEs accounted for all growth.  This is encouraging, as we need the US consumer to spend in order to grow.  Investment added some to growth.  Exports and imports were negligible.  Interestingly enough, we see that government spending subtracted from growth.


Looking at PCEs we see decent contributions from durable goods purchases.  This is good, as it indicates that people are willing to buy larger items and (most likely) in the process take on financing responsibilities.  Non-durables also added to growth as did service expenditures.  The only short-coming to this data series is that it could be higher.


What's interesting on the investment chart is the decrease in business investment.  CRE subtracted from growth, indicating there is still an over-supply on the market.  Equipment and software -- which had been growing strongly for the last few years -- added a paltry .13 to investment growth.  The good news here is the contribution from residential real estate, which added a little over half too total investment growth.  Should this pace continue, we could get a nice bump in GDP because of the multiplier inherent in residential investment.

Exports/imports were negligible.


Government spending subtracted from growth, with the biggest drops from from national defense spending and state and local spending.

So, here are the good and bad developments.

The good

People are sill spending
Residential investment may be picking up
Inventories are being restocked
Imports aren't killing growth

The Bad

Business investment dropped
Government spending is subtracting from growth
Ideally, we'd like to see higher PCEs

Shorter version: this is OK, but not great by any stretch of the imagination.


This is the graph that scares me


- by New Deal democrat

 Median wage growth:


This is the increase that 50% of workers are getting more than, and 50% are getting less than, on a year-over-year basis.  It has been running at under 2% at all times since the financial collapse of 2008.

So, even if inflation runs at the very modest rate of only 2% (and for most of the time since the bottom of the recession in 2009, it has been higher than that), more than half of all workers fail to keep up.

You simply cannot have a durable economic expansion where most workers are consistently falling behind.

There are a few other graphs that give me hope, but only on a temporary basis.

Mortgage refinancing:


Lower mortgage rates in the last several years has enabled a huge number of consumers to refinance.  Therefore...

Household debt ratios:


the average household has a lower carrying cost of debt, compared with their income, than at any point in the last 30 years [note that this series ends in December 2011, and won't be updated again until June sometime].

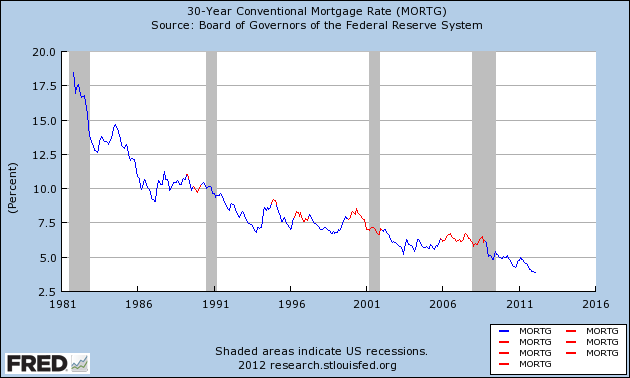
In the past 30 years,as shown in this graph of mortgage rates, which highlights those periods where interest rates are higher than they were 3 years prior in red, once households have been able to refinance, it took at least 3 years without new lows being established, before the economy fell back into recession.


 We just set new lows.

It's difficult to imagine any further round of refinancing once this one is done.  Can rates really go much lower?

If median wage growth doesn't improve soon,  there will be no escaping another recession once the effect of refinancing has run its course, and in the meantime, it's hard to imagine broad-based economic growth.

This time around, we managed to escape without actual wage deflation (although laid off workers may not have been able to find work at the same salary they were making previously).  I doubt we will be so lucky a second time, and we may not have even regenerated all the jobs lost in the last recession before the next one hits.  I doubt that happens this quarter, or this year, but the more time goes on, the bigger the risk becomes.

Spain Falls Into Recession --

It's yet another example of the amazing, unprecedented and roaring success of austerity!

From Marketwatch:


The Spanish economy contracted 0.3% in the first quarter of 2012, the second straight quarter of economic decline, officially putting the economy into recession, according to preliminary data released by the national statistics office. In the fourth-quarter of 2011, gross domestic product fell 0.3%. On an annual basis, GDP fell 0.4% in the first quarter, compared to a 0.3% annual rise in GDP in the fourth quarter of 2011. The government is targeting a 0.2% rise in GDP for 2013, but expects the economy to contract 1.7% this year. Economists polled by FactSet Research had forecast a 0.4% contraction in the first quarter, matching an estimate by the Bank of Spain


We've been over this more than a few times, so I'll make this brief:

Ireland tried it: fail
The EU tried it: fail
The UK tried it: fail
Spain tried it: fail

Folks, the data (as in facts) show a clear pattern: it doesn't work as advertised. 


Morning Market Analysis

My opinion about the markets:

The US equity markets are moving into a period of consolidation, largely caused by slowing world economies and less than robust US  growth.  I don't see a meltdown, but sideways consolidation.

Let's take a look at the three major equity indexes:


Since February, the IWMs have been trading between 78 and 84 with a declining MACD.  While the A/D line has been increasing, the CMF has been decreasing.


The QQQs were the best performing index, largely thanks to its technology-heavy orientation.  However, prices have been declining in a disciplined way since the beginning of April.  Also note the declining MACD over this time period.


The SPYs fall somewhere between the IWMs and QQQs; they have been moving sideways for a bit longer than the QQQs, but have an MACD profile that more closely resembles the QQQs.

For my opinion to change, I need to see two of the above averages move through the following price levels:

SPY: 143
QQQ: 69
IWM: 85


In addition, the US treasury market has again caught a safety bid all across the curve.  The IEIs (5-7 years) have been trading between 122.5 and 120; the IEFs (7-10 years) have been trading between 101.6 and 106 and the TLTs (20+ years) have been trading between 109.5 -118.6.  Also note that with all the charts above we see an increased Bollinger Band width, telling us that the treasury market is actually a bit more volatile now.


The dollar is not giving us any major indication in either direction; it's trading between 21.77 and 22.30, and has been for the last three months.


Sunday, April 29, 2012

100 False Prophecies by the Pied Piper of Doom: 20 - 31, bankruptcies are gonna crash and burn the economy! (2)


- by New Deal democrat

Introductory note: For those of you who aren't aware of the past history of the bloggers here with Daily Kos, or don't want to hear more about it, please pass on. Regular economic blogging will resume tomorrow. For those of you who do, here is the third installment in this periodic series. 


 Once again I request that you not cross-post this. Unfortunately you're not going to change anyone's mind. I simply decided that rather than having this sit unpublished in my computer, a record should be available. 


 This installment turned out to be so long, I had to split it into two sections. This is the second section. The first section can be found here. The first 10 false prophecies, "The stock market's gonna crash!" can be found here

The Reckoning continues....
==========

 The Pied Piper of Doom has been very sure that, well, just about everything is on the brink of bankruptcy that will surely cast the economy into the abyss. 

20. In October 2010 he said that the robosigning scandal would crash the recovery:
we are just beginning to ring the bells on a new, raging, eight-alarm fire within our economy which may (this is by no means inconceivable, at this point) undermine virtually all efforts at a recovery, to date, from the get-go; thus, further propelling our country into a downward trajectory which may already require generations to fully overcome. For the moment, we're calling this: "The U.S. Foreclosure Fraud Crisis." 
Didn't happen.  He was wrong.

 21. No, seriously.  That same month he said that  the mortgage industry was going to re-implode :
 For the second time in two years, our country's mortgage industry is imploding before our eyes. .... The proverbial sh*t's hitting the fan on this one, bigtime, just like the previous mortgage meltdown. And, the rumors are getting beyond scary, in terms of the implications these events may wrought with regard to our already-teetering economy. 
Still didn't happen.  He was still wrong.

22.. No matter.  Remember, from the same time period, the second Wall Street implosion of 2010?
Is Wall St. Imploding, Again? Krugman: It's "very, very bad."  
here's the latest big story, the business lede from Friday's NYT, with all of the bloody details which point out that this week--just like that week in mid-September 2008--may very well end up being another pivotal point (for all the wrong reasons) in our nation's economic history... .... The story provides the narrative over the past few days... --market uncertainty, worries about "the financials;" --everyone thought this would pass quickly, but that's looking "less and less likely;" .... The calendar tells us it's October 15th, but it sure looks like it's Groundhog Day to me. 
That didn't happen either.  He was wrong.

23.   A few days later, he said that the mortgage industry's MERS scandal was going to take down major Wall Street Firms.
isn't it now crystal clear to many of those that are following the Mozilo story, that it's just the tip of an iceberg of a lengthy list of memorialized events which all tell us that the entire mortgage mess is just a major chapter in a much bigger story of crony capitalism and corporate kleptocracy gone awry; a story which may soon record a second collapse of many major, too-big-to-fail (TBTF) Wall Street firms -- one which is not-so-quietly playing out over this weekend, but still unbeknownst to most. .... And if you're still doubting what's immediately ahead for the U.S. mortgage industry and the largest/TBTF Wall Street banks, and consequently much of our economy, you may want to checkout these three articles relating to the incredible pounding they're taking (quietly, behind the scenes, this weekend) Bank of America Wells Fargo .... just hours after I posted a diary, entitled: "Is Wall St. Imploding, Again? Krugman: It's "very, very bad," on Friday, had I known that the news on Mozilo would occur later that day, I would have retitled that post not as a question but as a statement of FACT: "Wall Street Is Imploding, Again. 
FACT: wrong. Again.

 24. Then in November 2010 he claimed that a New Jersey state court ruling would cause Bank of America to fail:
 When mortgages are "securitized" by the banks that originate them ("sponsors"), such as Bank of America -- whom we're slowly learning, this weekend, due to developments in a New Jersey bankruptcy hearing last week, may have actually and completely fallen into the insolvency abyss -- they're subject to a "pooling and servicing agreement." 
As of Friday it's stock was still trading on the NYSE.  He was wrong.

 25.  In early December 2010 he claimed that, in part due to a sure-fire devastating publication by Wikileaks, Bank of America was going to be forced to declare bankruptcy:
 While you may not have heard about it yet (you probably will start noticing it in the MSM soon, if not this morning), it appears that over the past 18 hours our country's largest bank, Bank of America, may have entered into the final stage(s) of a fairly swift implosion.  .... Apparently, the BofA story from ten days ago was just a teaser for the main act which started playing out on the MSM stage roughly 18 hours ago. Yesterday, MSM and blog stories started surfacing concerning two separate issues ... which provides an update to the story I started covering 10 days ago), with either one providing more than sufficient cause to drive the two-trillion-dollar behemoth into receivership, or worse--that place where almost all divine oligarchic institutions have gone of late: taxpayer exponential bailout hell. As you'll see, below, the bank is very much in Wikileaks' sights, and it's all but formally confirmed that they will be the subject of Julian Assange's next planned data dump, sometime in January. .... Any way one might look at these most recent developments, IMHO, from a myriad of perspectives, this latest BofA chapter in the over-arching story of our country's recent financial woes could easily turn out to be THE biggest nightmare yet. One thing that's obvious, if only for the past few hours, is that whatever's going down right now is happening very swiftly. 
The "biggest nightmare yet" apparently vaporized with awakening that day.  He was wrong.

 26.   A few days later, he made one his most preposterous predictions -- that Bank of America was within days, if not hours, of failing:
 Our country's largest bank has all but taken a final dive into the abyss. And, if you take a look at the lead in Sunday's NY Times, we're reminded it's not just the federal budgets that are hurting here. We're reminded that it's the United STATES of America: "Mounting State Debts Stoke Fears of a Looming Crisis." In Sunday's NY Times' lead, Michael Cooper and Mary Williams Walsh talk of an ongoing, massive collapse in state and municipal budgets around the country. Mounting State Debts Stoke Fears of a Looming Crisis By MICHAEL COOPER and MARY WILLIAMS WALSH New York Times December 5, 2010 ...Some of the same people who warned of the looming subprime crisis two years ago are ringing alarm bells again. Their message: Not just small towns or dying Rust Belt cities, but also large states like Illinois and California are increasingly at risk... The journalists focus upon commentary from Wall Street analyst Meredith Whitney, someone who's gained a well-earned reputation (she's also one of my favorites) for prescience due to the fact that she was one of the first to warn us of a mortgage meltdown. She now "...sees similar problems with state and local government finances." 
 As of Friday its stock was trading at $8.25 a share.  He was and is still wrong.

27.  As 2010 closed, he thoroughly bought into Meredith Whitney's prediction that states and municipalities would default in huge numbers in 2011:
As we turn the page of the calendar into 2011, here are some stunningly inconvenient truths about our so-called economic "recovery..." Many of our country's states and municipalities are in dire financial straits, and many may default in 2011. 
Meredith Whitney had one of the most spectacularly wrong predictions for all of 2011, and he was right along with her for the ride.  He was wrong.

28.   Beyond municipalities going bankrupt in droves, in January 2011 he also thought that states themselves would go bankrupt:
Up until now, the concept of states filing bankruptcy has been a moot point. According to various legal precedents, basic definitions of sovereign law, and the U.S. Constitution, it simply couldn't happen. Up until now... as today's New York Times' lead also informs us: "Bankruptcy could permit a state to alter its contractual promises to retirees, which are often protected by state constitutions..." The article does note: "It would be difficult to get a bill through Congress, not only because of the constitutional questions and the complexities of bankruptcy law, but also because of fears that even talk of such a law could make the states' problems worse." And, it's possible that our federal "lawmakers might decide to stop short of a full-blown bankruptcy proposal," opting for something along the lines of what was established to guide New York City through its fiscal crisis in 1975, which was the Municipal Assistance Corporation. But, call it what you wish for political purposes, there are many synonyms for the word: "bankruptcy."
I'll outsource the response to this, to Calculated Risk:
A recent article in the NY Times about "discussions" on state bankruptcies. Not Gonna Happen. Economix has California’s state treasurer, Bill Lockyer response: State Bankruptcies? ‘Ludicrous,’ He Says “It’s a cynical proposal, intended to incite a panic in response to a phony crisis,” Mr. Lockyer said in a conference call with journalists. “Killer bees, space aliens, and now it’s the invasion of the bankrupt states.” The state budget issues are serious. And the U.S. debt and deficit issues are serious too. But I've ignored the "debt ceiling" and "state bankruptcy" discussions for a reason - they are nonsense.
"Nonsense." I couldn't have said it better myself. He was wrong. 

Not content with simply being wrong about municipalities and states, this self-identified arbiter of what it means to be a progressive, thoroughly bought into the trope that by running deficits, even in the face of strong deflationary forces, the federal government was crowding out private borrowing, and the federal government's bond auctions would ultimately fail.  In so doing he clutched to his bosom and propagated a right wing meme that has been thoroughly eviscerated as fear of "invisible bond vigilantes" by both Professors Krugman and DeLong.

29. In February 2009 he claimed:
But are we already encountering problems selling our government debt to underwrite this? In his still-vague proposals, Geithner supports pouring an additional two trillion dollars in taxpayer funds to "stabilize" our nation's financial services sector and to get the credit markets flowing, once again. This assumes our government is even able to finance that debt with the sale of T-bills and bonds, etc. And, contrary to popular belief and the reality that the U.S. may just print money without any adverse consequences, we're already quickly learning--the hard way--that there's a limited market for our nation's unbridled debt, "Treasuries Drop as Dealers Digest $67 Billion in Notes, Bonds   
As Krugman has reminded us many times, treasury bond rates have fallen since then.  The Pied Piper of Doom was wrong.

30.  In May 2009 he reiterated this claim:
 QUESTION #3: Are the much ballyhooed "Quantitative Easing" efforts of Fed Chair Ben Bernanke failing miserably out of the gate? THE ANSWER: Initial results indicate this may be the case. In an effort to keep interest on the federal debt low (read: manageable), the Fed poured the first piece of its $1.2 trillion 2009 QE budget, or $300,000,000,000 of taxpayers' funds, into the purchase of US T-bills in mid-March. Interest rates immediately dropped dramatically as a result of that. But, market activity over the past week now has 10-year notes eclipsing rates in the market from the day before Bernanke flipped the proverbial Quantitative Easing switch, roughly six weeks ago. $300 billion to keep interest rates on our debt suppressed for six weeks? That's only $50 billion a week to buy down interest on our debt, only to see market demand for U.S. debt slacken dramatically shortly thereafter. Such a deal! 
To the contrary, the even lower rates now for treasuries show us that relative to other investments, U.S. is still a safe haven.  He was still wrong.

31In the same diary he claimed:
 QUESTION #4: From a purely market-driven perspective, are Wall Street bailout funding efforts inherently at odds with efforts to fund most of the other government-sponsored stimulus/bailout/Main Street programs? THE ANSWER: also appears to be, "Yes." Come to think of it, it's really just common sense, as the Business Insider blog tells us: "How Government Guaranteed Bank Debt May CRUSH Public Borrowing." If other government programs are offering better, guaranteed returns than T-bills and municipal bonds, etc., it's only logical that investors will be driven to those other investment vehicles.
Treasuries were yielding less than 2% last week.  He was spectacularly wrong, and spectacularly trumpeting a very Coolidge-like view as the one and only true progressivism as He Himself defined it for his acolytes.

 To be continued ... and continued ... and continued ....

Saturday, April 28, 2012

Weekly Indicators: April ends in a sea of green edition


- by New Deal democrat

In the rear view mirror, first quarter GDP was reported preliminarily at +2.2% on an annualized basis.  This was below expectations.  The biggest negative was government spending on all levels including a marked decrease in military spending due to the end of the war in Iraq.  This was still positive enough to push YoY GDP back above 2.0%.  Durable goods orders, a leading indicator, came in strongly negative, although this is a volatile series.  This in part appears to be an inventory correction.  Case Shiller home prices continued to decline YoY, but the m/m change in the seasonally adjusted data was positive.

Fittingly for April, the high frequency weekly indicators this week were a sea of green with a few yellows from unwanted data dandelions. Housing and employment continued to be the most significant areas.

Housing reports were positive:

 The Mortgage Bankers' Association reported that the seasonally adjusted Purchase Index increased -2.7% from the prior week, and were flat YoY. The Refinance Index reversed part of its huge gain from the prior week, falling -5.6%.This index is at the upper end of its 2 year generally flat range. Because the MBA's index was substituted for the Federal Reserve Bank's weekly H8 report of real estate loans in ECRI's WLI, I've begun comparing the two. This week for the fourth week in a row after 4 years of relentless decline, real estate loans held at commercial banks were up, +1.0% on a YoY basis. On a seasonally adjusted basis, these bottomed in September and are now up +1.7%.

 YoY weekly median asking house prices from 54 metropolitan areas at Housing Tracker were up +3.7% from a year ago. YoY asking prices have been positive now for close to 5 months. This week Case Shiller reported only the second month-over-month gain in housing prices in 5 years, excepting the months of the $8000 housing credit. For the last few months my mantra on house prices has been "something's gotta give." Either the list prices indexes (showing gains) or the repeat sales indexes (showing losses) had to turn. Right now it looks like the list price indexes which are being vindicated.

 Two of the three Employment related indicators were positive, while the third was strongly negative, appearently due to a seasonality issue:

 The Department of Labor reported that Initial jobless claims rose another 6,000 to 388,000 last week, the highest report since January. The four week average also rose by 6250 to 374,750. For the third week in a row, this is mirroring the big increase in April last year. In fact, for the entire last year the YoY% decrease in initial claims has been between 8% and 12%. So long as we stay in that range, I am satisfied that we are seeing a quirk of seasonality rather than a more ominous sign. Here is a graph highlighting in red the possible unadjusted second quarter seasonality for the last two years:


 The Daily Treasury Statement showed that for the first 19 days of April, $129.1 B was collected vs. $128.0 B a year ago, the first YoY gain in 3 weeks. In the last 20 reporting days, a more valid measure, $136.9 B was collected vs. $131.6 B a year ago, an increase of $5.3 B, or +4.0%.

 The American Staffing Association Index rose one more point to 91. It is rising and continues to remain close to its pre-recession readings of 2007. It is possible that it could exceed all readings but those of 2006 by June sometime.

 Sales remained solidly positive.

The ICSC reported that same store sales for the week ending April 21 rose+0.8% w/w and +3.6% YoY. Johnson Redbook reported a 2.7% YoY gain. Shoppertrak did not report. The 14 day average of Gallup daily consumer spending remained favorable at $74 vs. $64 in the equivalent period last year.

Money supply was positive:

 M1 rose +0.4% last week, and was up +1.4% month over month. Its YoY level increased to +18.2%, so Real M1 is up 15.6%. YoY. M2 was up +0.3% for the week, and was up +0.6% month over month. Its YoY advance remained at +9.9%, so Real M2 was up 7.3%. Real money supply indicators continue to be strong positives on a YoY basis.

Bond prices fell (a positive) and credit spreads were flat:

Weekly BAA commercial bond rates fell -.04% t0 5.15%. Yields on 10 year treasury bonds also fell -.04% to 2.00%. The credit spread between the two remained flat at 3.15%. This is significantly off its October lows, but has declined a bit since one month ago.

Rail traffic was mixed, with the same explanation as for the last month:

The American Association of Railroads reported a +0.6% increase in traffic YoY, or +3000 cars. Ex-coal, overall traffic was up by 22,500 cars, or +3.6% YoY. Intermodal traffic was up 12,600 carloads, or +6.0%.  Railfax's graph of YoY traffic continued to show that rail hauling of cyclically sensitive materials remains in strong improvement.

The energy choke collar remains engaged:

Gasoline prices fell for the second straight week, down .05 to $3.87. Oil rose to $104.93. Both of these remain above the point where they can be expected to exert a constricting influence on the economy. Gasoline usage, at 8496 M gallons vs. 9148 M a year ago, was off -7.1%. The 4 week moving average is off -4.2%. Since one year ago gasoline usage was beginning its big decline, these are actually relatively negative numbers.

 The high frequency indicators for the global economy also were positive:

 The TED spread fell back .02 to 0.380, at the bottom of its recent 2 1/2 month range. This index remains slightly below its 2010 peak. The one month LIBOR declined .001 to 0.239. It is well below its 12 month peak set 3 months ago, remains below its 2010 peak, and has returned to its typical background reading of the last 3 years.

The Baltic Dry Index at 1156 was up 91 from one week ago. It is now about 1/3 of the way back from its February 52 week low of 670 to its October 52 week high of 2173. The Harpex Shipping Index rose 6 to 416 in the last week, and is up 41 from its February low of 375.

 Finally, the JoC ECRI industrial commodities index rose strongly from 122.31 to 124.96. This indicator appears to have more value as a measure of the global economy as a whole than the US economy.

With one exception, the high frequency indicators give no hint of any meaningful deterioration in the economy.  To the contrary, the lion's share were positive.  The Oil choke collar remains engaged, and the non-winter winter and the quest for energy efficiency are affecting several areas of rail loads.  The only true negative comes from initial jobless claims, and the evidence there is that there is a seasonal issue (either due to the Oil choke collar or left over from readings during the recession) that is responsible.

Friday, April 27, 2012

Weekend Weimar, Beagle and Pitbull

It's that time of the week again. NDD will post the indicators on Saturday. I'll be back on Monday. Until then....


The US' Austerity in Charts -- Or, "Where is the Government Takeover Again?"

This chart is from Krugman:


This is actually pretty important - and it's a point we've made a few times.  A big reason for the high unemployment rate is the cut in government jobs, especially at the state and local level.  As Krugman notes:


If public employment had grown the way it did under Bush, we’d have 1.3 million more government workers, and probably an unemployment rate of 7 percent or less.

A few notes on GDP: OK, but not good enough

  - by New Deal democrat

By now I'm sure you've read several analyses elsewhere of this morning's GDP report.  I have no desire to duplicate those analyses, but wanted to add a few points relevant to what this means to everyman and everywoman.

1.  This is just a preliminary estimate.  In two months we could find out it was actually 1% or actually 3%.  And there will be even more revisions in a year or two.

2.  Assuming the final result is close to this estimate, we have an economy that grew enough in the first quarter to consistently add jobs - so this confirms that payrolls reports from January through March.

3.  What "socialism?"  Government spending actually subtracted from the result.  Nice to know that government austerity ... oh, never mind.

4.  Residential investment added to the growth.  This is more confirmation that the housing bust has already bottomed.  This is very good for the longer term, since residential construction is one of the premier long leading indicators of the economy.

5.  Median wage growth in the first quarter was +0.5%.  For the last year, median wages have only grown 1.7%.  You simply cannot sustain a consumer economy for too long on this kind of paltry growth.

So the verdict is, Ok but not nearly good enough, which pretty much summarizes this recovery which is getting close to 3 years old.

In passing, despite the Pied Piper of Doom's vile description of Bonddad as an apologist for the "status quo," the fact is Bonddad and I called for the creation of a new WPA almost exactly 3 years ago, and we've both called for massive spending programs funded by long term bonds (currently priced at 2% yields) to bring the US's failing infrastructure into the 21st century.  Imagine where we'd be now if that had happened.  Sigh.  Oh, well.

Why Austerity Doesn't Work

From Krugman:
For the past two years most policy makers in Europe and many politicians and pundits in America have been in thrall to a destructive economic doctrine. According to this doctrine, governments should respond to a severely depressed economy not the way the textbooks say they should — by spending more to offset falling private demand — but with fiscal austerity, slashing spending in an effort to balance their budgets.

Critics warned from the beginning that austerity in the face of depression would only make that depression worse. But the “austerians” insisted that the reverse would happen. Why? Confidence! “Confidence-inspiring policies will foster and not hamper economic recovery,” declared Jean-Claude Trichet, the former president of the European Central Bank — a claim echoed by Republicans in Congress here. Or as I put it way back when, the idea was that the confidence fairy would come in and reward policy makers for their fiscal virtue.

The good news is that many influential people are finally admitting that the confidence fairy was a myth. The bad news is that despite this admission there seems to be little prospect of a near-term course change either in Europe or here in America, where we never fully embraced the doctrine, but have, nonetheless, had de facto austerity in the form of huge spending and employment cuts at the state and local level.

So, about that doctrine: appeals to the wonders of confidence are something Herbert Hoover would have found completely familiar — and faith in the confidence fairy has worked out about as well for modern Europe as it did for Hoover’s America. All around Europe’s periphery, from Spain to Latvia, austerity policies have produced Depression-level slumps and Depression-level unemployment; the confidence fairy is nowhere to be seen, not even in Britain, whose turn to austerity two years ago was greeted with loud hosannas by policy elites on both sides of the Atlantic.

 None of this should come as news, since the failure of austerity policies to deliver as promised has long been obvious. Yet European leaders spent years in denial, insisting that their policies would start working any day now, and celebrating supposed triumphs on the flimsiest of evidence. Notably, the long-suffering (literally) Irish have been hailed as a success story not once but twice, in early 2010 and again in the fall of 2011. Each time the supposed success turned out to be a mirage; three years into its austerity program, Ireland has yet to show any sign of real recovery from a slump that has driven the unemployment rate to almost 15 percent
Krugman has been all over this story -- he was arguing against austerity long before I started writing about it.  Plus, he is, after all, one of the premier economists on the planet.  And he's right.  The argument that confidence would return  because of budget cutting is absolute garbage.  However, let me go a bit deeper and explain why.

First, the "austerians" assume that all government spending is bad and that all private sector spending is more efficient and effective.  This is a pretty bold assumption not born out by the facts. 
By way of example (and contrast), here are two charts from the Great Depression:


The first chart shows total, real GDP while the second shows YOY GDP growth rates.  This chart shows that by 1937, real GDP was higher than 1929 GDP largely because of the tremendous growth seen in GDP which is illustrated by the lower chart.  And - in case you're wondering -- the 1938 slowdown was caused by (drum roll please) austerity policies (you might want to read the Depression section in A Monetary History of the US by Milton Friendman to get a better idea of what happened). Many of the projects that were created during this period are still with us an paying dividends, such as Hoover Dam.

Second, as demonstrated by the recent EU and UK experience, austerity slows growth (see here and here).  This in turn creates a negative feedback loop -- lower GDP lowers demand and investment, which lowers GDP, etc...  Put another way, austerity continues to lower confidence instead of raising it because no one wants to invest in a slow growing economy.

Third, consider this chart of government spending from the CBO:

It shows government spending as a percentage of GDP going back to 1971.  Notice that this number has -- for the last 40 years -- been about 20%-21% of total GDP.  Some of this is mandatory spending some of it is discretionary.  But the point is this: it's always been there and it's a part of the economy.  This is one of the reasons I talk so much about the GDP equation (C+I+X+G=GDP), hoping that taking readers back to their days of basic math will somehow jog their memory regarding the policy implications of simple addition (which is regrettably lost on many people).   

Moreover, government provides things we use on a regular basis that have short term and long term implications.  The short term implications are things like income for people in the form of social security and unemployment benefits.  People spend these on a regular basis in order to live.  Then there are less visible (but still incredibly important) things like infrastructure and educational support which have pronounced long-term benefits for the country by bolstering and developing the physical and personal elements of the economy.  Both of these areas -- physical and personal infrastructure -- are seriously lacking in the US and need immediate attention if we're going to compete with countries in the 21st century.  

And yet, at a time when we need the investment for both a short and long term reasons (which we always do; the reasons are now simply more pronounced); people have forgotten about the need for and importance of this type of macro-level investment, instead arguing for a policy that does not work in any way shape or form -- at least if you look at the data coming out of the UK and the EU.  Put another way, you've put your hand on the stove, turned the


Morning Market Analysis


The SPYs spent 12 days consolidating between the 136-139 level.  However, yesterday, prices popped higher, breaking out of the range.


The daily chart shows prices moving beyond the trading range along with a buy signal about to emerge from the MACD.  However, given the fundamental backdrop, I'm not thrilled by this rally and need to see a lot more evidence to even think about getting excited.


The above chart of the IEFs is a big reason to not get excited about the move.  Treasury prices are at high levels in reaction to the underlying economic situation.  This is going to take money out of equities.


In addition, consider the EDE charts above.  Only the Chinese market (second from top) is showing any propensity to rally; all the other markets are at best treading water.


Thursday, April 26, 2012

Bonddad Linkfest

  1. Orders for Big Ticket Items Fall 4.2% (Marketwatch)
  2. Conference Boards Australian LEI unchanged (Conference Board)
  3. Latest Australian CB Minutes (RBA)
  4. Business climate indicator for the EU (EU)
  5. Topping or Consolidation (BP)
  6. Fed Statement (FRB)
  7. Bernanke has a lot of explaining to do (FT)
  8. South Korean growth slips to 2.8% (FT)
  9. Draghi calls for growth compact (FT)
  10. BoJ easing will remain in Japan (FT)

Should We Be Concerned About the Following?

There have been a few economic statistics over the last few weeks -- coming from the US -- that are concerning, although certainly not fatal.  Consider the following:


Durable goods orders peaked in January a bit below the 216,000 level, but are now declining.  For the last 5 months, the number has clustered around the 208 level.


Initial claims have spiked this month.  While the overall series is still down, these upward moves are concerning, especially considering the weaker reading coming from the latest US employment report (+120,000).


Industrial production has stalled for the last three months.

The above data series are extremely noisy, so it's important not to read too much into the monthly gyrations.  At the same time, all of these are occurring at the same time, which is, in and of itself, a concerning development.  

Is the US/China Trade Balance Stabilizing?


The above chart is simply US exports - Chinese imports.  What's interesting is that it appears to have three stages:

1.) 1985-2000; the slow build-up.
2.) 2000-2009/10: a massive move into an increased trade deficit where we see China become an incredibly strong and important trading partner
3.) the 2009/10 period to today -- a possible leveling-off.

It's still too early to make a firm conclusion from the data.  It's also important to remember that the US economic position for the last three years has fundamentally changed to one of slow growth and lower consumerism.  However, consider that Chinese labor is no longer cheap:

But while China’s industrial subsidies, trade policies, undervalued currency and lack of enforcement for intellectual property rights all remain sticking points for the United States, there is at least one area in which the playing field seems to be slowly leveling: the cheap labor that has made China’s factories nearly unbeatable is not so cheap anymore.

 China has experienced sporadic labor shortages, which in turn have driven up its once rock-bottom labor costs. This trend is particularly evident in the weeks following China’s Spring Festival, or New Year, when more than 100 million rural migrants return to the countryside to spend the year’s biggest holiday with family. Coaxing those same migrants back into the urban work force has proven increasingly difficult.

This year has been no exception. Although nearly two weeks have passed since the Lantern Festival that officially marks the end of the 15-day holiday, cities across China are still facing a serious labor shortfall. In order to lure new workers and retain the old, some companies give employees sizable bonuses just for coming back to work, while others offer cash for every new employee they bring along with them. And in many areas, wage increases ranging from 10 to 30 percent have become the norm.

Despite all this, cities like Beijing, Shenzhen and Guangzhou are still short hundreds of thousands of migrant workers. Shandong Province is missing a full third of its migrant work force, and Hubei Province reports a loss of more than 600,000 workers. Last week, the Chinese government released a report describing this year’s post-Spring Festival labor shortage as not only more pronounced than in years past, but also longer-lasting and wider in scope.

Numerous factors underlie China’s mounting labor woes. Until now the country has been able to achieve its stunning economic growth by shifting large numbers of farmers into nonagricultural jobs. Over the past several years economists have warned that China may be reaching the so-called Lewis Turning Point — the stage at which the rural surplus labor pool effectively runs dry and wages begin to rapidly increase.
A shortage of labor means higher cost.

OK, make that 101 false prophecies . . .

- by New Deal democrat

 The Pied Piper of Doom, March 7, 2012 (after Barry Ritholtz published Bonddad's "Message to political bloggers: please stop writing about economics, you really suck at it"):
I don't think you'll be seeing much more of that "other" blogger's economic spin on behalf of the status quo over at Ritholtz' blog, going forward. (A little birdie told me that. And, I think it's an accurate statement. We shall see...)
Barry Ritholtz' The Big Picture blog, April 25, 2012:
People Are Finally Figuring Out: Austerity Is Stupid by Hale Stewart.

Honestly, he's such an easy target ... but so  much fun ....

Morning Market Analysis

Given the news from the UK, let's start with their market:


The UK ETF is actually trading in a fairly tight trading range between ~16.8 and 17.75.  Prices are right above the 200 day EMA and the shorter EMAs are tangled with the 200 day. EMA.  The MACD has given a buy signal, but it's still in negative territory, so ideally prices should move through resistance before going long.  And then there's that recession thing ...


The British pound was trading in a range between 155 and 159 until it broke ouy a week ago.  The upside move was caused by the BOE's minutes indicating that no further easing was coming done the pike.  Given the overall tenor of the British economy, I would expect to see a sell-off soon, with prices moving to at least the 10 day EMA.


The French market broke support at the 21 level, moved to the 19.75 area and has since rebounded.  Prices are now entwined with the EMAs.  Given the political situation in France, this is a very difficult market to read.


Emerging Europe has been in a downward sloping channel for the last month and a half.  Prices are now below the 200 day EMA, and the shorter EMAs are below the 200 day EMA and are moving lower.  Money is leaving the market, and momentum is weak.  Prices have found support at the 50% Fib. level.

The good news in all the equity charts above is that we're not seeing a massive and sharp sell-off.  Instead, buyers are moving in to buy on the dips, indicating there are still enough people who see value in the markets.  Given the weakening position of the European economy overall, that, in and of itself is a good thing.