Monday, June 10, 2024

The recessionary Household Jobs Survey is not confirmed by other comprehensive hard data


 - by New Deal democrat


As per usual, the Monday after jobs report Friday does not update any significant data.


So let me return to the deep divergence between the Household and Establishment Surveys in the jobs report. With Friday’s data for May, the two have now diverged 1.9% over the past year, adjusted for the size of the prime working age population:


This big a divergence has only happened previously twice in the 1960s, and one month each during the pandemic and the 1980s. There is clearly a big issue going on. Either the data in one or both series is simply wrong, or the implications of the data in one or both series is incorrect. I spent a fair amount of time during the weekend poking around all sorts of data, and I think I can shed some light on that, but it will take much more than one post.

Let me just begin by restating that the Household Survey for May was simply recessionary. The “real time” Sahm Rule as of May is at .37. The below graph subtracts that amount and shows the entire historical record before the pandemic:


The only times this reading has not meant recession was twice in the 1960s, once in the 1970s, and for several months in 2003.

I’ll spare you the additional graphs, but the same is apparent with the YoY changes in the unemployment and underemployment rates.

And total employment is only up 0.2% YoY. Here’s what a historical graph of that looks like pre-pandemic:


With the exception of two solitary months in 2003 and 2013, there has never been a time since the 1960s when such a paltry YoY increase has not meant recession.

But the Household and Establishment Surveys are not the only official data of employment. The Quarterly Census of Employment and Wages (QCEW) is a comprehensive accounting of the same, covering over 95% of all businesses. It’s one big drawback is that there is no seasonal adjustment, so we have to look at it YoY. It also lags badly, so the most recent update is for Q4 of last year, and further, all of last year’s data is still preliminary and subject to revision.

Nevertheless, let’s compare that with the YoY% changes in employment in the two jobs surveys, through the end of last year:


At the end of Q4 2022, the Establishment Survey showed gains of 3.0% YoY. By the end of 2023, that had declined to 2.0%. Meanwhile, over the same period the YoY gains in the Household Survey had declined from 2.0% to 1.2%.

Although FRED doesn’t have graphs for the QCEW, here are the YoY% gains shown in that Census as of the end of each quarter from Q4 2022 through Q4 2023:

2.8%, 2.5%, 2.5%, 1.7%, 1.5%

Through the end of Q2, the QCEW is in good agreement with the updated Establishment Survey. But in Q3 and Q4, there is a subtantial (as, 0.3% and 0.5%) variance, suggesting that upcoming benchmark revisions to the Establishment Survey will reduce those levels by about 700,000.

For 2024, we can’t rely on the QCEW. But we do have the comprehensive daily update of all withholding taxes paid to the government. The one caution here is that such taxes are paid on things like the vesting of stock options, and not just wages. This is important, because a huge amount of stock options vested and were cashed in at the end of 2022.

With that caveat, here is what the 1 month and 3 month moving average of the YoY% change in withholding taxes paid look like beginning last December through the end of May:

DEC 23. -11.2%. -0.8%
JAN 24. +5.7%. -0.8%
FEB 24.  +8.3%. +0.1%
MAR 24. +2.2%. +5.3%
APR 24. +17.1%. +9.0%
MAY 24. +2.5%. +6.7%

The monthly totals are somewhat volatile, as you can see. But once we smooth the data out over three months, and once the December 2022 stock options drop out of the picture, all of the comparisons are positive. 

The bottom line is that neither of our two comprehensive comparative data - the QCEW and withholding taxes paid - look recessionary at all. In other words, while the unrevised Establishment Survey readings might be too high, the Household Survey readings on the change in employment look much too low.

But is there reason to believe that the Sahm rule might not be flashing recessionary warnings after all? More on that in another post.

Saturday, June 8, 2024

Weekly Indicators for June 3 - 7 at Seeking Alpha


 - by New Deal democrat


My “Weekly Indicators” post is up at Seeking Alpha. 

The stock market was conflicted by yesterday’s jobs report, but the bond market’s verdict was unequivocal: ignore the unemployment rate; it was a strong report which will stay the Fed’s hand from raising rates. 

Meanwhile, coincident economic data in particular continues to look very expansionary. And the long leading indicator of corporate profits turned positive, as Q2 earnings are expected to be sharply higher.

As usual, clicking over and reading will bring you up to the virtual moment as to the state of the economy, and reward me a little bit for organizing it and presenting it to you.

Friday, June 7, 2024

Houston, we have a serious problem: the two job surveys show two completely opposed economies


 - by New Deal democrat


In the past few months, my focus has been on whether jobs gains are most consistent with a “soft landing,” i.e., no further deterioration, or whether deceleration is ongoing. In particular: 
  • Yesterday I wrote that “I will be most interested to see if declines in manufacturing and housing under construction translate into a stall or even downturn in goods-producing employment, which has held up surprisingly well in the past year.”  - This month they again increased, with no indication of any slowdown in trend.
  • Whether there is further deceleration in jobs gains compared with the last 6 month average, vs. a “soft landing” stabilization, and even whether the recent increase in monthly jobs numbers signifies a re-strengthening. - This was also answered plainly with no further deceleration at all. A look back shows average jobs gains holding basically steady, with the exception of last summer, for over 1 year.
  • Based on the leading relationship of initial and continuing jobless claims, whether the unemployment rate is neutral or decreasing; or whether there is further weakness. - This month’s increase completely contradicted both initial and continuing jobless claims, the unemployment rate increased again. 
  • Based on the leading relationship of the quits rate to average hourly earnings, whether YoY wage growth would stabilize, or decline further. - This month they increased from April’s 3 year low.

There is a common thread in the above answers: the three good results all came from the Establishment Survey, which as we’ll see below, was very strong. The one very poor result came from the Household Survey, which for the third time in four months was frankly recessionary.

Here’s my in depth synopsis.


HEADLINES:
  • 272,000 jobs added. Private sector jobs increased 229,000. Government jobs increased by 43,000. 
  • March was revised downward by -5,000, and April was revised downward by -10,000, for a net decline of -15,000. This continues the pattern from nearly every month in the past 18 months of a steady drumbeat of downward net revisions.
  • The alternate, and more volatile measure in the household report, showed an outright *decline* of -408,000 jobs. On a YoY basis, in this series only 376,000 jobs, or 0.2%, have been gained. This is not just the lowest YoY increase since the pandemic lockdowns, but with rare exception, it has always and only occurred during recessions.
  • The U3 unemployment rate rose 0.1% to 4.0%, a new 2+ year high. Not only did the number of people employed decline, per the above, but the number unemployed rose by 157,000.
  • The U6 underemployment rate was unchanged at 7.4%, 0.9% above its low of December 2022.
  • Further out on the spectrum, those who are not in the labor force but want a job now rose 80,000 to 5.717 million, vs. its post-pandemic low of 4.925 million in early 2023.

Leading employment indicators of a slowdown or recession

These are leading sectors for the economy overall, and help us gauge how much the post-pandemic employment boom is shading towards a downturn. These were generally positive:
  • the average manufacturing workweek, one of the 10 components of the Index of Leading Indicators, rose 0.2 hours to 40.8 hours, but is still down -0.7 hours from its February 2022 peak of 41.5 hours.
  • Manufacturing jobs rose 8,000.
  • Within that sector, motor vehicle manufacturing jobs rose 3,500. 
  • Truck driving declilned -5,400.
  • Construction jobs increased 21,000.
  • Residential construction jobs, which are even more leading, rose by 3,500 to another new post-pandemic high.
  • Goods producing jobs as a whole rose 25,000 to another new expansion high. These should decline before any recession occurs.
  • Temporary jobs, which have generally been declining late 2022, fell by another -14,100, and are down about -450,000 since their peak in March 2022. This appears to be not just cyclical, but a secular change in trend.
  • the number of people unemployed for 5 weeks or fewer rose 47,000 to 2,309,000.

Wages of non-managerial workers
  • Average Hourly Earnings for Production and Nonsupervisory Personnel increased $.14, or +0.5%, to $29.99, for a YoY gain of +4.2%. This breaks, at least for this month, the pattern that YoY growth in wages have been sliding since their post pandemic peak of 7.0% in March 2022.

Aggregate hours and wages: 
  • the index of aggregate hours worked for non-managerial workers rose 0.4%, and is up 1.6% YoY.
  •  the index of aggregate payrolls for non-managerial workers rose 0.9%, and is up 5.8% YoY. These had been decelerating since the end of the pandemic lockdowns, but have stabilized so far this year, and are close to their highest YoY pace since last September. With the latest YoY consumer inflation reading of 3.4%, this remains powerful evidence that average working families have continue to see gains in “real” spending money.

Other significant data:
  • Professional and business employment rose 33,000. These tend to be well-paying jobs. This series had generally been declining since last May, but in 4 of the last 5 months have resumed their increase.
  • The employment population ratio declined -0.1% to 60.1%, vs. 61.1% in February 2020.
  • The Labor Force Participation Rate declilned -0.2% to 62.5%, vs. 63.4% in February 2020.


SUMMARY

This month’s report marked perhaps the strongest bifurcation yet between the Establishment and Household Surveys. Frequently they diverge, but this as if they were describing two diametrically opposed economies. 

The Establishment Survey was excellent. Not only were there top-line gains, but almost all of the leading sectors of employment - construction, manufacturing, goods production generally, and even the recent laggard of professional and business jobs - all rose significantly. Aggregate hours and payrolls also rose sharply. Wage growth improved. If anything, even beyond stabilization, there appears to have been some re-acceleration in job gains in recent months compared with late last year. Only temporary jobs - which appear to be undergoing a secular change - continued to decline.

But then we turn to the Household Survey. The number employed was down, the number of unemployed up, resulting in the highest unemployment rate in over 2 years (although it has not triggered the “Sahm rule”). The number of recent job-losers also increased to a 2+ year high, but for one month (February). Both the employment population ratio and the labor force participation rate declined further. In fact, in this report employment has only grown 1.8% since March 2022 (vs. 4.8% in the Establishment Survey), and has been in a slowly *declining* trend since last summer. 

At this point it is nearly certain that one of these two surveys is seriously in error. Normally that would be the Household Survey, which is much smaller and noisier. That at this point it is flatly contradicting the weekly jobless claims numbers - which are not surveys, but actual totals collected from all 50 States - also suggests that it is the Household Survey which is in error. But then we have the QCEW, which is also not a survey, but rather a census of almost all employers in the country, telling us that through Q3 of last year (its most recent report) the Establishment Survey was seriously overestimating job gains. And then we have withholding tax receipts - also not a survey, but an actual nationwide total - which over 8 months into this fiscal year are only 4.2% higher (and that’s nominal, before taking wage gains into account) than last year at the same time. 

Ultimately the data in the Establishment and Household Surveys are going to resolve. That is likely to occur when some fairly massive revisions in one or the other take place. It could be a big population revision in the Household Survey, or it could be that the QCEW is going to show more substantial weakness in Q4 of last year and/or Q1 of this year, which will then be incorporated into revisions in the Establishment Survey.

I wish I could tell you that I knew. But I am afraid that we are simply going to have to wait.

Thursday, June 6, 2024

Initial jobless claims now in a confirmed seasonal uptrend, but still positive for the economy


 - by New Deal democrat


My “quick and dirty” economic status indicator is the stock market (still making new all-time highs) and initial jobless claims, which are also still positive for the economy despite being in an apparent uptrend.


Last week initial claims rose 8,000 to 229,000, their second highest level in the past 9 months. The four week moving average declined -750 to 222,250, just below its own 9 month high of the week prior. With the usual one week delay, continuing claims rose 2,000 to 1.792 million, right about in the middle of their 10 month range:


Some of this, as I have speculated in the past month, may be some residual post pandemic seasonality that has not been worked out, given last year’s similar increase.

As per usual, the YoY change is what is most important for forecasting purposes. And there the news is considerably better, as initial claims were down -10.2%, and the four week moving average down -5.2%. Continuing claims were up 4.2%, which is a negative, but on the other hand, as noted above, these have been in a tight range for the past 10 months, so I do not believe they are much of an issue:


The bottom line is that the initial claims indicator remains positive for the economy as to the next few months.

Finally, as we await tomorrow’s jobs report, here is our last update as to the May Sahm rule indicator:


Because initial claims lead the Sahm rule by several months at least, the May upturn in initial claims does not put any upward pressure on the unemployment rate, and indeed the late winter and early spring downturn in claims should still be feeding through. Nor are continuing claims, which have a more slight lead, putting any upward pressure on the unemployment rate. In short, there is no support for the “Sahm rule” being triggered.

So tomorrow I am looking for no increase, and a possible decrease, in the unemployment rate. Per my discussion of the JOLTS report, I am looking for stabilitzation or no more than a slight deceleration in average hourly earnings gains. And I will be most interested to see if declines in manufacturing and housing under construction translate into a stall or even downturn in goods-producing employment, which has held up surprisingly well in the past year.

Wednesday, June 5, 2024

ISM weighted manufacturing + services indexes signal continued expansion


 - by New Deal democrat


I never used to pay much attention to the ISM non-manufacturing report. That is partly because it only has a 20 year history, and partly because it seems to be more coincident than leading:


But because manufacturing has faded so much as a share of the US economy, with at least two false recession signal in the past 10 years (2015-16 and 2022-23):


there is no choice but to pay more attention.

In particular, it does seem that when we include this as part of a weighted average (75%) along with the ISM manufacturing index (25%), it has generated a much more reliable, and still timely, reading over this Millennium (note: graph ends last summer):


On Monday, the ISM manufacturing index, and its more leading new orders component, came in poor. But the non-manufacturing index this morning completely outweighed that in its strength. Here are the last five months of both the manufacturing (left column) and non-manufacturing index (center) numbers, and their weighted average (right):

JAN 49.1. 53.4. 52.3
FEB 47.8  52.6. 51.4
MAR 50.3. 51.4. 51.1
APR 49.2  49.4.  49.3 
MAY 48.9. 53.8. 52.5

And here is the same data for the new orders components:

JAN 52.5. 55.0. 54.4
FEB 49.2  56.1. 54.4
MAR 51.4. 54.4. 53.6
APR 49.1. 52.2. 51.4
MAY 45.4. 54.1. 51.9

Only the weighted average for the total indexes for one month, April, comes in below 50. To generate a reliable signal, we would need the 3 month average to be below 50, which it clearly is not. The new orders weighted average for all months is unambiguously positive.

The signal for the combined weighted ISM indexes remains expansionary in its forecast for the next few months.

One more thing about the April JOLTS report: hiring and quitting remain very, very good


 - by New Deal democrat


I’ll write about today’s ISM non-manufacturing report later, but first I wanted to follow up with several more graphs based on yesterday’s JOLTS labor report for April. Basically, I didn’t want to leave the impression that the labor market was in any way sub-par based on those numbers.


With that in mind, below are two graphs. Both show the entire history of hires (red) and quits (gold) normed to 100 as of the yesterday’s report. Both show that, in raw numbers, only 2018-19 were stronger than even yesterday, let alone earlier in the post-pandemic recovery.

In this first graph I also show the civilian labor force (number of people employed + unemployed) (blue), also normed to 100 as of yesterday. Where the blue line is lower than the red and yellow lines, the *rate* of persons being hired or voluntarily quitting is higher now. Where the blue line is higher, the current rate of hiring and quitting is lower:


As you can see, the current pace of voluntary quits remains higher than at any time except 2018-19 and the tail end of the 1990’s tech boom (when the data series began). Hires are kind of “meh” - not bad, but not good either.

I’m not totally satisfied with that, because the strength of the jobs market also has an effect on people choosing to enter or leave it. So this second graph substitutes the prime age population, ages 25-54 (blue), again normed to 100 as of yesterday’s data:


As a share of the prime working age population, quits are as high as they ever were before the pandemic, and hiring was only better in 2000 and 2018-19.

In other words, this paints a picture of a labor market that has cooled from White Hot Boom levels to merely very, very good.

Tuesday, June 4, 2024

April JOLTS report: firming in hires, quits, and a (good) decline in layoffs, while fictitious job openings continue their slide


 - by New Deal democrat


The JOLTS report for April showed most metrics rebounding slightly from March lows, with the exception of the “soft data” job openings. The overall picture is that hiring is weak relative to the past five years, but so are layoffs, and voluntary quits are equally relatively strong, balancing them out.

To wit: job openings (blue in the graph below), a soft statistic that is polluted by imaginary, permanent, and trolling listings, declined -another 296,000, form a downwardly revised March, to yet another three year low of 8.059 million (vs. a pre-pandemic peak of 7.594 million). Actual hires (red) rose 23,000 from an upwardly revised March to 5.640 million (vs. a pre-pandemic peak of 6.0 million). Voluntary quits (gold) rose 98,000 from an upwardly revised March to 3.507 million. In the below graph, they are all normed to a level of 100 as of just before the pandemic:


As has been the case for the past nine months, hires are below the level they were at just in early 2020 just before the pandemic hit. Meanwhile, quits are essentially equal to their pre-pandemic level.

The above situation has been considerably helped by layoffs and discharges (blue in the graph below), which made a sixteen month low, and continue to run roughly 20% below the level they had been at *any* point before the pandemic:


As with last month, the more leading weekly initial jobless claims (red) suggest that layoffs and discharges will remain close to this range at least for several more months.

Finally, the quits rate was unchanged at 2.2% for the sixth month in a row, after an upward revision from March. Since, as I have noted for a number of months now, the quits rate (blue in the graph below, right scale) tends to lead average hourly earnings (red) [and here’s the long-term view]:


This suggests that the deceleration in wage growth will probably not decelerate much further in upcoming months, as shown in the below post-pandemic close-up:


My big concern over the past year has been if a further deceleration in wage growth were to coincide with an upturn in inflation, because that would likely cause a decline in real consumer income and spending. While there is no reason in today’s numbers to discount the longer term post-pandemic trend of deceleration, there was no further deceleration in April.


Monday, June 3, 2024

May new manufacturing orders slide, truck sales rise, construction spending close to unchanged


 - by New Deal democrat


As usual, the month starts out with important data on manufacturing and construction. The news was mixed this month, and weighted more to the downside in my opinion.


First, the ISM report on manufacturing declined again slightly to 48.7. This is the second month in a row that this index has been under the equipoise point of 50. More importantly, the more leading new orders subindex declined sharply to 45.4, the lowest reading since last May:


The silver lining here is that manufacturing is not nearly so important to the overall economy as it was in the 50 years after World War 2, so a negative reading like this - similar to what we had in 2022-23 - does not necessarily mean recession. But it does mean that the ISM services index, which will be released on Wednesday, and declilned below 50 for the first time last month, assumes extra importance. That’s because in the 20 years since the latter index has been in existence, when the weighted average of the two indexes has been below 50, that did mean recession.

Another leading sub sector in manufacturing is heavy truck production and sales. These were released for April at the end of last week, and there the news was good, as truck sales rebounded 13.5% in the month, and are only down -3.6% YoY:


Heavy truck sales lead light vehicle sales to the downside, but generally must be below peak by 20% to be consistent with a recession. Their three month moving average is about 13% off peak, which still indicates weakness, but no recession signal.

Turning to construction, total nominal spending declined -0.1% in April, but is higher 10.0% YoY. The more leading residential sector showed a 0.1% increase, and only a -0.1% YoY decline:


Since producer prices for construction materials declined -0.4% in April and are down -0.3% YoY, the “real” residential construction numbers are more positive:


Finally, the Inflation Reduction Act, which conferred favorable tax benefits for “restoring,” led to a sharp increase in manufacturing construction spending, which increased 0.9% for the month to another new record, up 17.3% YoY:


Again, altogether these paint a very mixed picture, but with new manufacturing orders declining significantly, and total and residential construction spending more or less flat for the past half year, I believe there is more weight to the downside.

Saturday, June 1, 2024

Weekly Indicators for May 27 - 31 at Seeking Alpha


 - by New Deal democrat


My “Weekly Indicators” post is up at Seeking Alpha.


None of the high frequency indicators made any meaningful change this week. The short term outlook continues to be positive. As I wrote yesterday in my summation of the personal income and spending report, the leading goods-producing sectors of manufacturing and construction are most important to my analysis of where the economy goes from here.

As usual, clicking over and reading will bring you up to the virtual moment in re the state of the economy, and bring me a little pocket change in reward for my efforts organizing the material for you.

Friday, May 31, 2024

April personal income and spending: a flat report consistent with either a temporary pause or weakness ahead


 - by New Deal democrat


Personal income and spending has become one of the two most important monthly reports I follow. This is in large part because the big question this year is whether the contractionary effects of Fed tightening have just been delayed until this year, or whether the fact that there have been no rate hikes since last summer mean that the expansion will strengthen.

Because real personal spending on services for the past 50 years has generally risen even during recessions, the more leading components of this report have to do with spending on goods. Additionally, there are several components that form part of the NBER’s “official” toolkit for determining when and whether a recession has begun, including real spending minus government transfers, and real total business sales. 

Let’s look at each of them in turn. Note that in all graphs below except for YoY comparisons, and the personal saving rate, is normed to 100 as of just before the pandemic.

Real income and spending

In April, nominally income rose 0.3%, while nominal spending rose 0.2%. Since prices as measured by the PCE deflator increased 0.3% for the month, in real terms income was unchanged and spending declined -0.1%. Since the pandemic recession, real spending is up 10.9% and real income is up 6.9%:


On a YoY basis, the PCE price index is up 2.7%, the third month in a row higher than January’s three year low of 2.4%. While n the previous 16 months, the YoY measure had been declining at the rate of 0.25%/month, suggesting that it would hit the Fed’s 2.0% target this spring, that trend has stopped, there is no indication at this point that the inflation rate is actually increasing either:


As I have been noting for the past few months, for the past 50+ years, real spending on services has generally increased even during recessions. It is real spending on goods which declines. Last month real services spending rose 0.1%, while real goods spending declined -0.4% (black in the graph below), only partly reversing March’s revised 0.9% gain.

Breaking goods spending down further, in April spending on consumer durables (red) declined -0.1%, vs. a larger -0.5% decline in real spending on non-durables (blue). In the past, spending on durables has tended to turn down before spending on non-durables. Here’s the current update:


On a YoY basis, all three series are running close to 2% higher, which has been typical since the turn of the Millennium, as shown prior to the pandemic:


As you can see, spending on durable goods is particularly volatile. So the stall in that spending, while not good, is not particularly foreboding either.

Savings

Another important metric for the near future of the economy is the personal savings rate. The sharp declines of a combined -0.9% In February and March were revised to only -0.5%, and in April it remained unchanged at 3.6% (vs. the original 3.2% last month). This longer term look shows how the present compares with the all time low rate of 1.4% in 2005:


Historically this is nevertheless a very low rate, only exceeded to the downside by 2005-07 and 2022, indicating continued vulnerability to an adverse shock. One of my forecasting models uses such a shock as a recession warning indicator. In any event, there is no such shock indicated at the moment.

Important coincident measures for the NBER

Also as indicated above, the NBER pays particular attention to several other aspects of this release. Real income excluding government transfers (like the 2020 and 2021 stimulus payments) was unchanged for the month. This metric had been in a rising trend since November 2022, but has stalled since January. Before 1990 a pause such as this over at least three months had almost always been associated with recessions. Since then, as shown in the above graph, they have been much more frequent. So at the moment, this is not significant:


Finally, the deflator in this morning’s report is used to calculate, with a one month delay,  real manufacturing and trade sales. This declined -0.1% in March, and for the third month in a row is below its November and December 2023 readings:


Like real personal income ex-government transfers, before 1990 a decline like this typically was associated with recessions or within a year before. Since then, there have been many such pauses without it being significant in the longer term.

Still, let me update the graph I ran on Wednesday showing 5 important producer and consumer series:


With today’s data, 4 of the 5 series are either flat or down significantly. The 5th, real aggregate payrolls for nonsupervisory workers, will be updated in next week’s jobs report.

Summary

This was not a good report. But to repeat a theme noted several times above, it wasn’t a bad report either. Basically a flat report. The pause of the past several months is consistent with both a renewed upturn, or a turn to the downside.

Especially with the downturn in the past several months of the leading sector of housing under construction, what it does do is give a higher level of importance to next week’s ISM manufacturing and services reports.  I will be looking to see if the weighted average of the two is trending higher, lower, or flat. Since the ISM manufacturing report in particular has a long history of leading the economy, should that weighted average decrease below its equipoise point of 50, that would mean that both leading sectors of the goods producing economy are forecasting further weakness ahead.

Thursday, May 30, 2024

Slight increasing trend in initial jobles claims, but continuing claims continue slightly lower


 - by New Deal democrat


Initial jobless claims rose 3,000 last week to 219,000. More importantly, the 4 week moving average rose another 2,500 to 222,500, the highest level in 9 months. With the usual one week lag, continuing claims rose 4,000 to 1.791 million:


On the one hand, it does appear that claims have been in a small uptrend for the last four weeks. But on the other hand, recall that there was a similar increase last May into summer, so there could be some unresolved post-pandemic seasonality in play.

As usual, though, the YoY% changes are more important for forecasting purposes. Here, initial claims were down -5.2%, and the four week average down -2.0%. Continuing claims remained higher by 3.6%, but aside from two weeks in April, this is the best YoY comparison in 15 months:


This does not suggest any significant weakening of the jobs market. It also does not suggest any upward pressure on the unemployment rate for May, which will be reported next week:


Since the unemployment rate lags initial claims by several months, they are supplying downward pressure on unemployment. Meanwhile continuing claims having been in a flat to slightly declining trend for over half a year, suggests no further upward pressure and some slight downward pressure on unemployment as well. As a result, next week I anticipate we will see an unemployment rate of between 3.7%-3.9%.

Wednesday, May 29, 2024

The good news, bad news economy


 - by New Deal democrat


We’ll get weekly unemployment claims tomorrow, and the very important personal income and spending report Friday, before we begin the slew of reports for the beginning of June next week. But since there’s a slow news day today, let’s take a bigger picture look at the state of the economy.


As always, you can find optimistic data if you look for it, and DOOOMish data as well. Usually - and right now is one of those usual periods - you can find a mix of both.

So let me begin with some large-scale data on the producer and consumer sides of the economy all together. That’s what this first graph below does. It includes manufacturing production (light blue) and real manufacturing and trade sales (dark blue) from the producer side of the economy, real aggregate payrolls (dark red)and real spending (light red) on goods from the consumer side, and building units under construction (gold) from housing, which straddles the middle. All are normed to 100 as of just before the pandemic, and also I’ve cut volatility on the housing construction metric by half so that it doesn’t reduce all the other data to squiggles:


Immediately we see that the producer side is not doing so well. Production is down, and real sales may still be rising slightly, or may have stalled. Meanwhile housing under construction, which rose 40% in the first two years of the pandemic (remember I cut the volatility by half), stalled out and has now turned down.

But the consumer side is a different story entirely. Real aggregate payrolls have continued to rise strongly, and real consumer spending on goods has risen even more strongly.

It’s also worth re-upping my “quick and dirty” economic indicator of stock prices and (inverted) initial jobless claims, both of which are still positive:


Because real aggregate payrolls has had a perfect record of leading the economy as a whole by at least several months for the entire past half century, and because real spending on goods also has generally peaked before a recession begins, here are the YoY% changes in both of them, first historically before the pandemic:


And here since the onset of the pandemic:


Both of these are currently running in the 2%-2.5% YoY growth range, typically the sign of continued economic growth in the near term, unless there is sharp deceleration, which there has not been.

On Friday we’ll get updates on two of the five data series in the first graph - real spending on goods and real manufacturing and trade sales. Next Friday, of course, will be the jobs report. Additionally, next week I’ll be paying close attention to the ISM reports, to see if the weighted average of manufacturing (25%) and services (75%) are above or below their “50” level tipping point, and what the trend is. Since the turn of the Millennium, it has only been when this weighted average has declined below 50 that a recession has been in the offing.

Tuesday, May 28, 2024

Repeat home sales indexes renew favorable YoY comparisons, suggest slow deceleration in shelter CPI to continue


 - by New Deal democrat


The FHFA and Case Shiller repeat sales indexes are the last home sales and price data for the month.

Two months ago I wrote that “for the next seven months the comparisons will be against an average 0.7% increase per month in 2023. Because house price indexes have shown a demonstrated lead over shelter costs as measured in the CPI, if present trends continue, as these YoY comparisons drop out, the YoY deceleration in OER in the CPI index should continue towards its more typical rate of between 2.5% to 4% YoY in the ten years before the pandemic.” Last month I reiterated that “I continue to believe that CPI for shelter will continue to decelerate on a YoY basis, but more slowly than before.”

Both of those trends were burne out with this month’s release for repeat sales through March. The FHFA purchase only price index, after a sharp 1.2% increase in February, only increased 0.1% in March. Meanwhile the Case Shiller National index rose 0.3%, down from its 0.5% increase in February. Keeping in mind that mortgage rates lead sales, which in turn lead prices, here’s what the monthly numbers look like for the past five years, compared with mortgage rates (red, right scale) averaged monthly:


The relatively big decrease in mortgage rates between last November and this January led to a big increase in sales with an increase in prices as well. As mortgage rates have climbed in the past few months since then, sales have declined somewhat, and prices have started to follow suit.

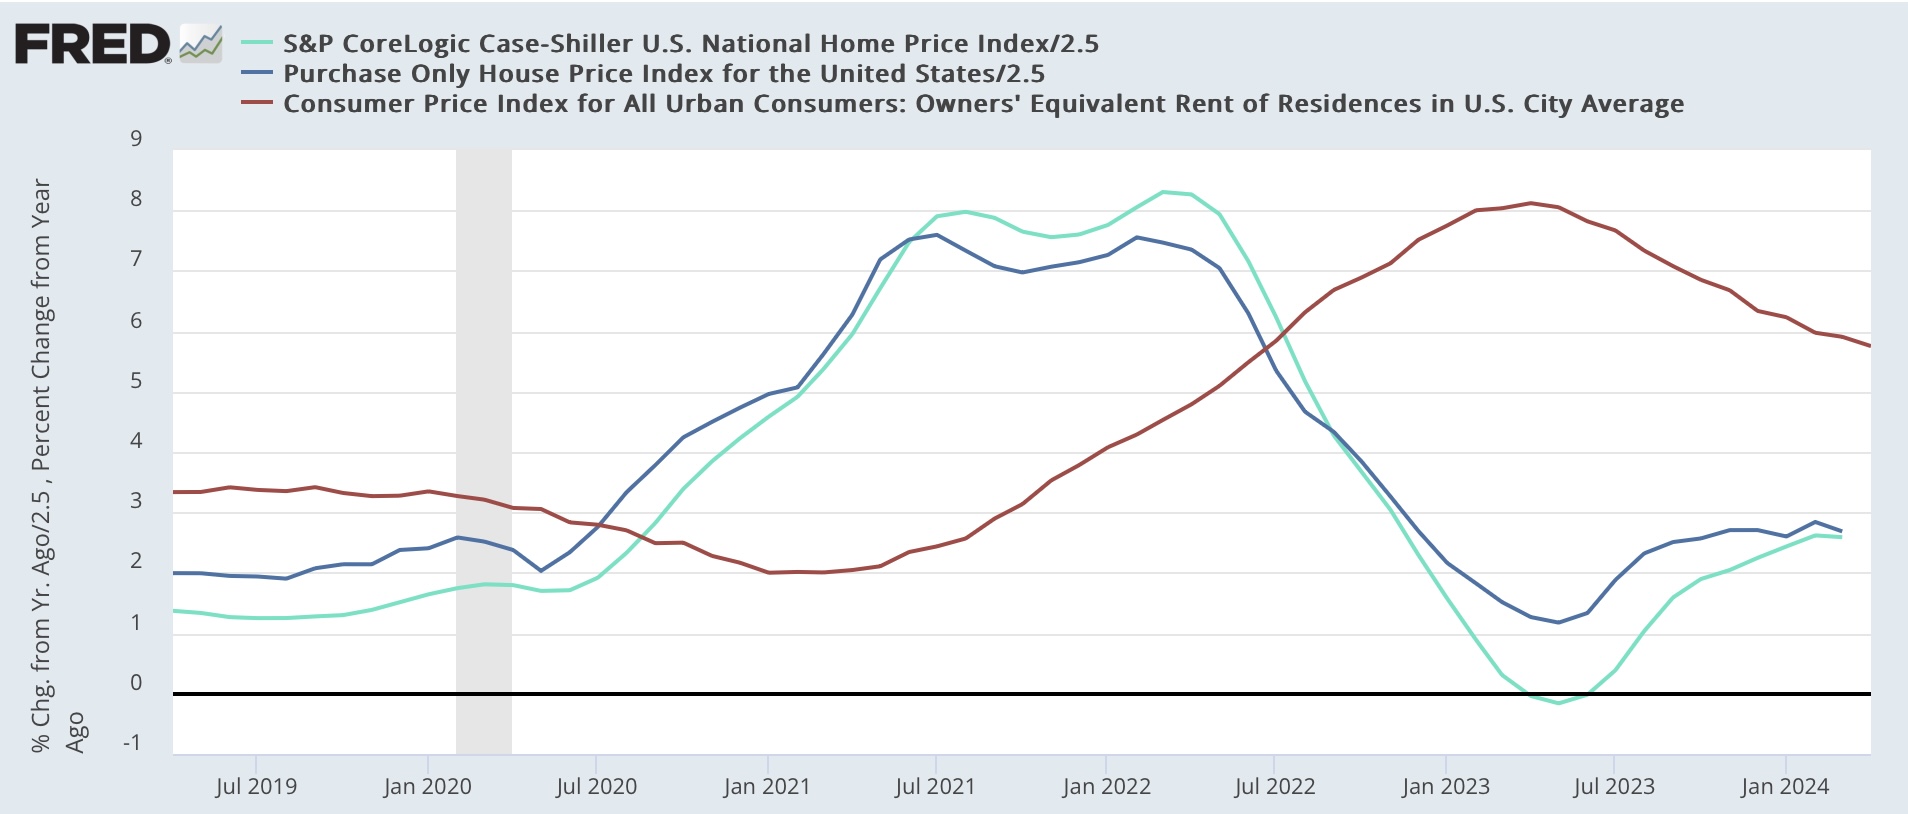
Next, here is the long term YoY graph of both of them below, compared with the CPI for owners’ equivalent rend (red, *2.5 for scale) which continues to show that the YoY gains are actually not out of line compared with gains during the majority of the past 25 years outside of recessions:


Here’s the close-up view of the last five years, better to show the current trend in both prices and shelter inflation for owners:


On a YoY basis, the FHFA index decelerated from a 7.0% increase to 6.7%. The Case Shiller Index declined by less than -0.1% so rounded to an unchanged 6.5% YoY increase. Since the FHFA has had a historical tendency to lead the Case Shiller data by one month, I generally pt a little more weight on that index.

The bottom line remains that there has been no significant YoY acceleration in the FHFA repeat sales index for the past six months, and appreciation in the Case Shiller Index has likely halted, with a lag, as well. Because, as I wrote at the outset, the next five months data will be compared with 0.7% average monthly gains last year (as you can see from the first graph above), I expect the YoY comparisons to show renewed deceleration, which will ultimately - with a decided lag - show up in the shelter component of CPI as well.

Finally, remember that these are all existing home sales, which have been severely constrained by homeowners being locked into the golden handcuffs of 3% mortgages. With limited inventory on the market, there is more compateition among potential buyers moving up from rentals, and thus there is more price appreciation than would normally be the case.