- by New Deal democrat
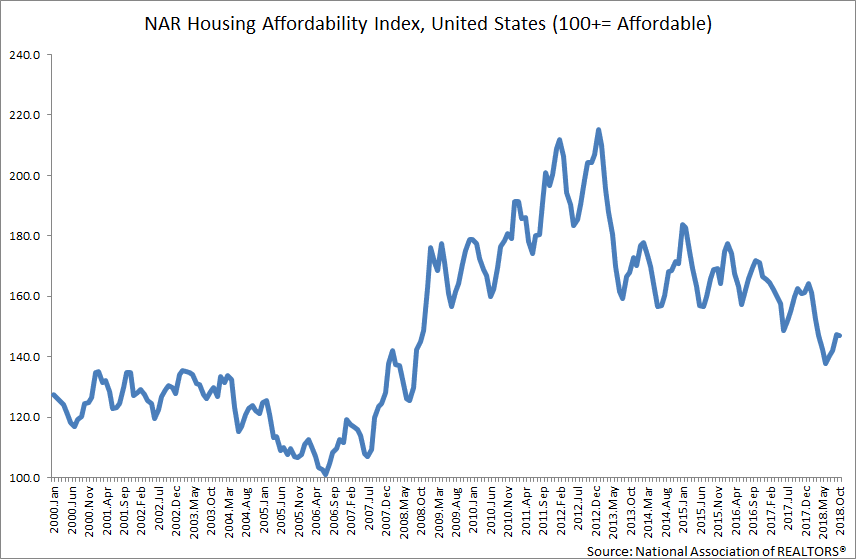
I have one of my periodic “Big Picture” looks at housing up over at Seeking Alpha.
- by New Deal democrat
I have one of my periodic “Big Picture” looks at housing up over at Seeking Alpha.
- by New Deal democrat
My Weekly Indicators post is up at Seeking Alpha.
Over the past few months, indicators across all timeframes have deteriorated. With increasing interest rates, and another Fed rate hike, that trend continued, and spread to credit conditions in a significant way.
As usual, clicking over and reading will bring you up to the virtual moment, and will bring me some lunch money.
- by New Deal democrat
Initial jobless claims rose 19,000 to 200,000, continuing above the recent 50+ year low of 166,000 set in March. The 4 week average also rose by 8,000 to 188,000, compared with the all-time low of 170,500 set four weeks ago. On the other hand, continuing claims declined -19,000 to 1,384,000, yet another new 50 year low (but still well above their 1968 all-time low of 988,000):
- by New Deal democrat
The two most important purchases ever made by most consumers are (1) their houses, followed by (2) their motor vehicles. Indeed, according to Prof. Edward Leamer‘s forecasting model, ever since the end of World War 2 almost all American recessions have been preceded by, first of all, a decline in new home purchases about 6-7 quarters before, followed by a decline in the purchase of new motor vehicles about 9-12 months before.
- by New Deal democrat
In March, as this morning’s Census Bureau JOLTS report shows, the game of musical job chairs in the jobs market has actually intensified to all-time levels. Specifically, both job openings and quits made all-time highs, and total separations during their entire 20 year history were only higher in March and April 2020.
As a refresher, some months ago I introduced the idea that the jobs market was like a game similar to musical chairs, where employers added or took away chairs, and employees tried to best allocate themselves among the chairs. Because of the pandemic, there are several million fewer players trying to sit in those chairs, leaving many empty. As a result, wages have continued to increase sharply, as employers attempt to attract potential employees to sit in the continuing big number of empty chairs.
- by New Deal democrat
As per usual, the new month starts with updates on manufacturing and construction.
The ISM manufacturing index, and especially its new orders subindex, is an important short leading indicator for the production sector. This remained positive, but there has been a definite slowing in the past two months.
In April the index declined from 57.1 to 55.4, and the new orders subindex also declined from 53.8 to 53.5, the lowest reading since 2020. As noted above, these remain positive, since the breakeven point between expansion and contraction is 50:
- by New Deal democrat
My Weekly Indicators post is up at Seeking Alpha.
Conditions have been deteriorating for awhile. This week, for the first time, real M2 and at least one credit condition reading contributed to that deterioration in the long leading forecast, enough to make a significant difference.
To get brought up to speed on the potential implications, click on over and read the post. As usual, doing so will also reward me just a little bit for the efforts I put in to obtaining and aggregating the information.
- by New Deal democrat
In March nominal personal income rose 0.5%, and spending rose 1.1%. But since the personal consumption deflator, i.e., the relevant measure of inflation, rose 0.9%, real income declined -0.4%, and real personal spending rose only +0.2%.
While both real income and spending are well above their pre-pandemic levels, I have stopped comparing them with that, but instead with their level after last winter’s round of stimulus. Accordingly, the below graph is normed to 100 as of May 2021:
- by New Deal democrat
First things first: yes, it was a negative GDP print. No, it doesn’t necessarily mean recession. I’ve been expecting weakness to show up by now ever since last summer; so here it is.
But the big culprits were non-core items. Personal consumption expenditures, even adjusted for inflation, were positive. The three big negatives were a big decline in exports vs. imports, followed in about equal measure by a decline in inventories and a downturn in defense production by the government. The inventory adjustment is temporary. So, most likely, was the downturn in defense production. We’ll see about exports and imports (supply chain issues!).
But there are two components of GDP which are helpful in finding out what lies ahead: real residential fixed investment (housing) and proprietors income (a proxy for business profits). Both of these have long and good track records as helping forecast the economy one year in advance. Here, the news was mixed, but a little more positive than negative.
Proprietors income (blue in the graph below) rose 1.2% nominally. Since unit labor costs have averaged an increase of 0.9% per quarter over the last year, they probably rose to a new high on an adjusted basis as well. This generally rises and falls with corporate profits (red), although it is not quite so leading. But since the latter won’t be reported for at least another month, it is a good placeholder:
So, this was a positive.
The news was more mixed in housing. Real private residential fixed investment rose slightly:
Further, both nominal and real residential fixed investment as a share of GDP (the actual measurement that is part of the long leading indicators) also rose for the quarter:
So far, so good.
The problem is that recessions have typically happened on average 7 quarters after the last peak in this measure. And even with the improvement in Q1, this measure is still below its peak of one year ago. So real residential investment is still a negative for forecasting purposes.
In addition to the above two long leading components of GDP, real money supply for March was reported on Tuesday, and the news wasn’t good there, either.
Recessions have typically occurred one year or more after real M1 turns negative, or real M2 is up by less than 2.5% from one year previous. Here’s what they look like through March:
Real M1 is up 2.4% YoY, and has deteriorated rapidly, although it is still a positive. Real M2 is also up less than 2.5%, which means it is consistent with an oncoming recession.
All in all, the picture continues to deteriorate, even though the profits component held up in Q1.
- by New Deal democrat
[Programming note: I’ll comment on the Q1 GDP report later this morning].
Initial jobless claims declined -5,000 to 180,000, but above the recent 50+ year low of 166,000 set in March. The 4 week average rose 2,250 to 179,250, compared with the all-time low of 170,500 set three weeks ago. Continuing claims declined -1,000 to 1,407,000, yet another new 50 year low (but still well above their 1968 all-time low of 988,000):
“[In summary, a]s of February 2022, approximately 75% of children and adolescents had serologic evidence of previous infection with SARS-CoV-2, with approximately one third becoming newly seropositive since December 2021. The greatest increases in seroprevalence during September 2021–February 2022, occurred in the age groups with the lowest vaccination coverage ....”
- by New Deal democrat
New home sales declined -8.6% in March, which isn’t a sharp as it seems, since declines of this magnitude happen 2-3x/year. The series is also heavily revised, so no new month’s number should be given too much weight. On the other hand, new home sales are frequently the first series to decline after a peak, so the fact that they have not made a new high since January of last year, and are now almost 25% below that mark is certainly a sign that higher interest rates and prices have taken their toll:
- by New Deal democrat
One of the things I harp on from time to time is that from 1932 to 1956 there was never a yield curve inversion, and yet recessions certainly did happen! Too many modern models get hung up on Fed intervention.
But what happens when the Fed doesn’t intervene, as was the case for that 25 year period? Or is perhaps the case now, with the Fed funds rate at record levels below the inflation rate?
The case of the immediate postwar Boom of 1946-48 and the recession of 1949 bears a lot of similarities to our current situation - but some significant differences too.
I wrote a lengthy post about it, and it is up at Seeking Alpha.
A factor I didn’t even get in to in that discussion was how the GI Bill, and the swift integration of returning servicemen into the labor force mirrors the swift increase in re-employment of those laid off during the initial period of lockdowns and closures.
For example, the modern unemployment rate statistics just started to get published in 1948, and like now, it was close to 3%:
As usual, by clicking over and reading, you should learn some important historical information, and it also puts a couple of pennies in my pocket as well.
- by New Deal democrat
My Weekly Indicators post is up at Seeking Alpha.
While I was writing about mortgage rates during the week, the yield curve did some re-tightening, enough to make a difference in the long term forecast.
As usual, clicking over and reading should help bring you up to the virtual minute as to the nowcast and forecast for the economy, and help me pay for some nice tapas the next time I dine out at a Spanish restaurant.
- by New Deal democrat
No important economic news today, but an important negative trend in interest rates is continuing. Mortgage rates are now at 12 year highs.
- by New Deal democrat
Initial jobless claims declined -2,000 to 184,000, another 50+ year low. The 4 week average rose 4,500 to 177,250, compared with the all-time low of 170,500 set two weeks ago. Continuing claims declined -58,000 this week to 1,417,000, a new 50 year low (but still well above their 1968 all-time low of 988,000):