- by New Deal democrat
Let me start this post by picking up where I left off yesterday.
- by New Deal democrat
Let me start this post by picking up where I left off yesterday.
- by New Deal democrat
One of the main reasons I include the last two years when I write about initial and continued jobless claims is that a distinct unresolved post-pandemic seasonality has developed. Even after seasonal adjustment, claims have tended to rise in the late spring towards the summer, and then decline beginning in late summer towards the winter.
- by New Deal democrat
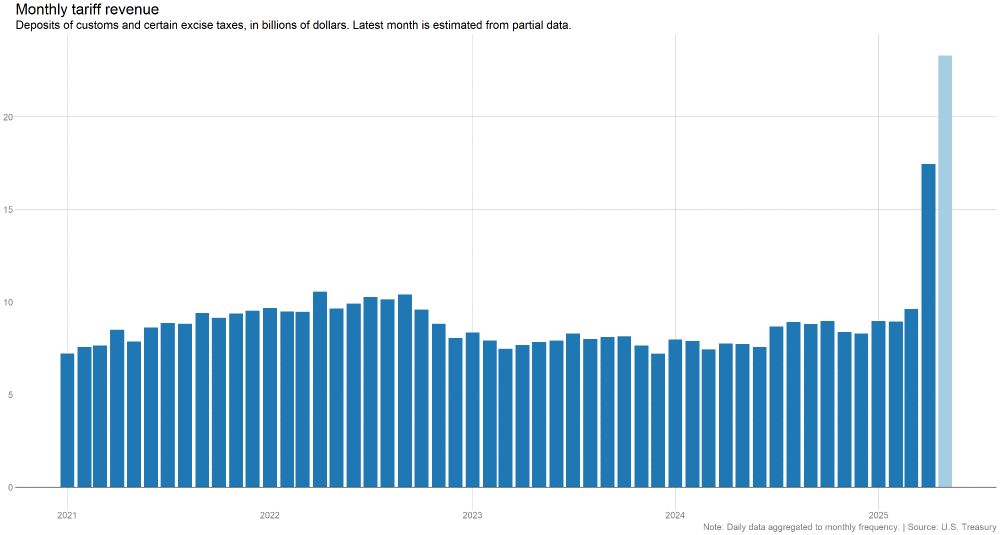
There’s no significant new economic data today, so let’s take an updated look at the downstream effects on the supply chain and retail sales so far from T—-p’s tariffs.
- by New Deal democrat
Last week the existing home sales report showed continued deceleration in YoY price increases to 1.8%, indicative of the ongoing rebalancing of the housing market. This morning’s repeat home sales reports from the FHFA and S&P Case Shiller confirmed that deceleration and ongoing rebalancing.
On a seasonally adjusted basis, in the three month average through March, the Case-Shiller national index (light blue in the graphs below), showed a declne of -0.3%, and the somewhat more leading FHFA purchase only index (dark blue) declined -0.1%. These monthly changes were the lowest since late 2022 [Note: FRED hasn’t updated the FHFA data yet]:
- by New Deal democrat
“… [O]ur fathers brought forth on this continent, a new nation, conceived in Liberty, and dedicated to the proposition that all men are created equal.
“Now we are engaged in a great civil war, testing whether that nation, or any nation so conceived and so dedicated, can long endure…. We have come to dedicate … a final resting place for those who [ ] gave their lives that that nation might live. It is altogether fitting and proper that we should do this.
“But, in a larger sense, we can not dedicate-we can not consecrate-we can not hallow-this ground. The brave men, living and dead, who struggled here, have consecrated it, far above our poor power to add or detract. The world … can never forget what they did here. It is for us the living to be here dedicated to the great task remaining before us-that from these honored dead we take increased devotion to that cause for which they gave the last full measure of devotion-that we here highly resolve that these dead shall not have died in vain-… that government of the people, by the people, for the people shall not perish from the earth.”
[Above photo: Gettysburg National Cemetery]
- by New Deal democrat
My “Weekly Indicators” post is up at Seeking Alpha.
The effects of Tariff-paloooza! are like a slowly building tsunami. The tide rolled out, but now far out at sea there is a horizon to horizon white wall of foam.
In this case, the first significant sign that decreased contained cargo from across the Pacific is showing up in intermodal rail traffic, which after being up cumulatively 8.7% for the year at the end of March, was only up 0.3% YoY last week:
Meanwhile the effects of the Big Bad Bust-out Budget Bill also showed up in a near 4 year low to the US$:
As usual, clicking over and reading will bring you up to the virtual moment as to the current and likely near term future state of the economy, and reward me with a penny or two for my efforts.
- by New Deal democrat
By way of background, remember that housing responds first and foremost to mortgage rates, and since those have been rangebound generally in the 6% - 7% range for 2.5 years, so have new home sales in the range of 611,000-741,000.
In April, new home sales increased 10.9% month over month to 743,000, just beyond the top of the above range, making a new 3 year high, from a sharply downwardly revised March. In the below graph I also show single family permits (red, right scale), which lag slightly but are much less noisy:
Both demonstrate the recent range bound behavior, with permits slightly lagging, and new home sales making the new high mentioned above.
Over the same 2.5 year period of time, prices also stalled, and then began a very slow deflation on the order of -1% -5% YoY. This continued last month, as on a non-seasonally adjusted basis, while the median price of a new single family home increased 3,500 to 407,200, on a YoY basis (not shown) it was down -2.0%:
In general they are not that important for forecasting purposes, since they have much less economic impact than new home sales, because the main effect is simply a change in ownership. But (as I’ll include in a graph below) there has been an ongoing shortage of housing for over a decade, which was only exacerbated by the pandemic. So I mainly look at this data for evidence of a rebalancing of the market.
Like new home sales, the sales of existing homes have been rangebound for the past 2 years, in reaction to mortgage rates remaining in the 6%-7% range. In April they remained within that range, at 4.00 million annualized on a seasonally adjusted basis. The below graph shows the last 10 years, showing both the immediate post-COVID surge and the low but rangebound trend since:
Now let’s look at inventory. Note that the secular decline in this began well before onset of the pandemic. Unlike sales, this series is not seasonally adjusted, so it must be looked at YoY. In April inventory continued to climb from its 2022 Covid lows, to 1.450 million units, a 20.8% YoY increase, and only 1,000 units lower than April 2020:
Nevertheless inventory remains well below its pre-2014 levels, which typically were in the 1.7 million to 1.9 million range, which means that the shortage still exists.
Finally, let’s look at prices. Builders of new homes are much more able to respond to market pressures, and - tariffs aside for the moment - this has continued to make new homes relatively much more attractive than the constricted existing homes market, which has had strong upward pricing pressures right through the end of last year.
The good news is that there is strong evidence that this upward pricing pressure is abating. Like inventory, this data is not seasonally adjusted and so must be looked at YoY, as in the graph below of the last 10 years:
In the immediate aftermath of the pandemic in 2021-22, prices increased as much as 15% or more YoY. After the Fed started its sharp hiking regimen, prices briefly turned negative YoY in early 2023, with a YoY low of -3.0% in May of that year. Thereafter comparisons accelerated almost relentlessly to a YoY peak of 5.8% in May of 2024, before decelerating to 2.9% in September.
Here are the comparisons since:
In April this deceleration continued, with a YoY% gain of 1.8%, the lowest such gain since early 2023.
This is good news, but as indicated above pricing pressures will remain until the shortage of inventory is resolved. Additionally it may reflect caution in part due to the nonsensical economic “policies” coming out of Washington.
So let’s sum up. Most significantly, both new and existing home sales reports for April showed that the rebalancing of the housing market is continuing. And the 3 year high in new home sales is very positive, even if it is a noisy statistic which may get revised away next month, because manufacturing has been flat to declining in the past three years, meaning that construction has been important in the continued expansion of the economy. This month’s reports say that (tariff-palooza! excepted) no recession is imminent.
- by New Deal democrat
The story continues to be “same old, same old” with unemployment claims.
- by New Deal democrat
Today let me address the GOP bust-out budget bill, and how that plays into Moody’s downgrade of US debt last week.
- by New Deal democrat
A few days ago Prof. Menzie Chinn at Econbrowser posted the below graphs comparing the time that hard vs. soft data reacted to economic shocks:
- by New Deal democrat
Until Thursday we are once again in a data drought this week. In the meantime, there are a few points I want to address, including the very important Moody’s downgrade of US debt.
- by New Deal democrat
My “Weekly Indicators” post is up at Seeking Alpha.
Changes due to Tariff-palooza! are happening very slowly. Most noteworthy this past week, rail traffic is still running ahead of rail traffic in the same week one year ago. But when we focus just on the intermodal container traffic, which is the main type coming from overseas, the growth rate of the volume - while still higher cumulatively than the first 4.5 months of 2024 - has slowed down comparatively almost every week since late March, suggesting that very slowly at least the backlog from front-running is being resolved.
As usual, clicking over and reading will bring you up to the virtual moment as to the economy, and bring me a penny or two in lunch money.