Monday, January 13, 2025

Scenes from the last employment report of Joe Biden’s Presidency


 - by New Deal democrat


Friday’s jobs report was an excellent one for Joe Biden’s Presidential term to end on. In the past 4 years, 17 million jobs have been created. Even if we take out 2021 as being a COVID rebound year, in the past 3 years there were 9.8 million new jobs, an average of 272,000 jobs per month. Meanwhile the unemployment rate declined from 6.7% at the end of 2020 to 4.1%. It rose 0.2% from 3.9% three years ago, ranging from a low of 3.4% to a high of 4.2%, which is still an excellent record. Real average nonsupervisory wages are up 0.6% from December 2020, and 1.3% from December 2021 - not so great, but still positive. And since average wages in 2020 were distorted by layoffs mainly affecting lower income workers, if we measure from December 2019, real wages have risen 4.8%.


Not too shabby.

But let’s focus on a couple of items from last Friday’s report beyond the headlines.

One of the important revelations in the past year has been how the nearly 6 million new immigrants since 2020 have distorted the unemployment rate, even as job growth has been robust. So this month let’s break out this rate for native born vs. foreign born workers. Remember that new workers who can’t find jobs don’t file for jobless claims, and Los Illegales generally do not either.

The below graph breaks out the YoY% change in initial jobless claims (light blue) vs. the total unemployment rate (light red); and compares both with the total of initial + continuing jobless claims (dark blue) and the unemployment rate for the native born only (dark red):
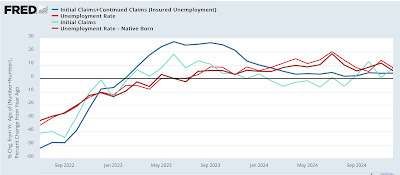


Initial claims always lead, but those unemployed also include people with continuing claims. So while it is less leading, the unemployment rate tracks closer to the total. And in this expansion, the unemployment rate for the native born tracks even closer than that. The inclusion of continued claims helps explain why the unemployment rate never ticked lower YoY in 2024, while the limitation of the unemployment rate shows a much less noisy leading/lagging relationship. As of December, while initial claims were higher YoY by 7.4% vs. the total unemployment rate being up 7.9%*, the combination of initial plus continuing claims were up 3.9% vs. native born unemployment being up 5.7%* (*remember these are percent changes of a percentage).

Now let’s turn our attention to employment in the goods producing sector. Recall that historically, services employment almost never actually goes down more than a fraction except in severe recessions. The decline in employment during recessions is almost all about declines in goods-producing jobs. And goods producing jobs are a leading indicator, always peaking some months before a recession begins:


Goods producing jobs in turn fall almost totally into two categories: manufacturing and construction. In the following graphs I break out the two categories separately, and focus on the recession since the 1980s.

Note that in the mid-1980s manufacturing already had a substantial downturn, but construction jobs grew strongly. It was only when both turned down in 1989-90 that a recession was forecast:


The 2001 recession by contrast was producer-led.  Construction jobs continued to grow very slowly into that recession, but manufacturing turned down sharply in advance:


Manufacturing jobs continued to decline during the “China shock” of the 2000’s, but the downturn accelerated in advance of 2007, and was joined by a downturn in construction jobs in 2007:


At present construction jobs are still increasing, while manufacturing jobs have turned down slightly:


It’s helpful to also compare this information YoY, which the next two graphs do in 20 year increments:


The closest comparison to the present is with the 2001 recession, but by the onset of that recession manufacturing jobs were down -2.1% YoY, while construction jobs were only up 1.3% and in a sharply deteriorating trend. At present, manufacturing jobs are down only -0.7%, while the trend in construction jobs has been one of slow deceleration, currently at 1.6% YoY. 

While the downturn in goods producing jobs as a whole from a peak three months ago is definitely cautionary, such minor downturns have happened many times before without a recession beginning. In other words, we have a necessary but not sufficient leading indicator at present. Most importantly, at present I am focusing on construction jobs, which seem to be levitating in the face of a downturn in the housing market and a small downturn in total construction spending. If the construction sector joins the manufacturing sector in deterioration, it will be much more concerning. But it isn’t now.

Saturday, January 11, 2025

Weekly Indicators for January 6 - 10 at Seeking Alpha


 - by New Deal democrat


My “Weekly Indicators” post is up at Seeking Alpha.

The big changes this week were the sharp increases in long term interest rates, along with similarly sharp increases in commodity prices and the US$. Some of this is due to a feeling that the economy is running “hotter” than recently thought, and frankly a lot is almost certainly due to the belief that the policies of the incoming T—-p Administration are likely to create lots of international friction and inflationary money-printing.

As usual, clicking over and reading will bring you up to the virtual moment as to the state of the economy, and reward me a little bit for categorizing and organizing it all for you.

Friday, January 10, 2025

December jobs report: ho ho ho, Santa brought a gift - but with a couple of lumps of coal mixed in


 - by New Deal democrat


My theme for the past several years as to employment has been “deceleration,” as in a gradual cooldown from white hot to red hot to hot to warm. But at some point past “warm,” we get to lukewarm, and then cool, and then chilly. In other words, if it continues at some point “deceleration” transitions into “deterioration.” A “soft landing” would require that the deceleration end, and the numbers stabilize. That’s what I was watching out for last year. 

So this month I have continued to be on the lookout for stabilization vs. deterioration.

Additionally, we have to be particularly careful at this time of year to overweight any one month, due to seasonality. Yes, of course these numbers are seasonally adjusted, but the Holiday season is particularly hard to get right.

Below is my in depth synopsis.


HEADLINES:
  • 256,000 jobs added. Private sector jobs increased 223,000. Government jobs increased by 33,000. Even including October’s poor number, the three month average was an increase of +165,000.
  • The pattern of downward revisions to previous months continued in part this month.. October was revised upward by 7,000, while November was revised down by -15,000, for a net decline of -8,000.
  • The alternate, and more volatile measure in the household report, showed an increase of 478,000 jobs. On a YoY basis, this series increased 537,000 jobs. This is good news after two of the previous three months had shown a YoY decline.
  • The U3 unemployment rate fell -0.1% to 4.1%. Since the three month average is 4.133% vs. a low of 3.7% for the three month average in the past 12 months, or an increase of just over 0.4%, this means the “Sahm rule” is once again not triggered. The rate for native born workers declined -0.2% (NSA) to 3.7%, up 0.2% YoY and that for foreign born workers also declined -0.2% (NA) to 4.3%, but was higher by 0.5% YoY. 
  • The U6 underemployment rate declined -0.2% to 7.5%, 1.1% above its low of December 2022.
  • Further out on the spectrum, those who are not in the labor force but want a job now increased 22,000 to 5.505 million, vs. its post-pandemic low of 4.925 million in early 2023, but showing a continued slow decline in the past 12 months.

Leading employment indicators of a slowdown or recession

These are leading sectors for the economy overall, and help us gauge how much the post-pandemic employment boom is shading towards a downturn. This month they were mixed:
  • the average manufacturing workweek, one of the 10 components of the Index of Leading Indicators, rose 0.1 hour to 40.9 hours, and November was also revised higher by 0.1%. This remains down -0.6 hours from its February 2022 peak of 41.5 hours, but on the other hand is the highest since December two years ago.
  • Manufacturing jobs declined -13,000. This series is firmly in decline.
  • Within that sector, motor vehicle manufacturing jobs declined -4,100.
  • Truck driving declined -800.
  • Construction jobs increased another 8,000.
  • Residential construction jobs, which are even more leading, rose by 3,500 to another new post-pandemic high.
  • Goods producing jobs as a whole declined -8,000, and are now -27,000 below their September peak. This is especially important, because these typically decline before any recession occurs. As I wrote two months ago, “in the absence of special factors this would be a serious red flag for oncoming recession.”
  • Temporary jobs, which have generally been declining since late 2022, rose by 5,300, the second increase in a row.  These had declined over -550,000 since their peak in March 2022, so this is good news which may signal that the bottom in this metric is in. 
  • the number of people unemployed for 5 weeks or fewer fell -52,000 to 2,166,000. This is in line with its range for the past 12 months.

Wages of non-managerial workers
  • Average Hourly Earnings for Production and Nonsupervisory Personnel increased $.06, or +0.2%, to $30.62, for a YoY gain of +3.8%, the lowest since their post pandemic peak of 7.0% in March 2022. Nevertheless, and importantly, this continues to be significantly higher than the 2.7% YoY inflation rate as of last month.

Aggregate hours and wages: 
  • The index of aggregate hours worked for non-managerial workers rose 0.2%. This measure remains up 1.1% YoY, which is in line with its trend for the past 18 months.
  • The index of aggregate payrolls for non-managerial workers was rose 0.4%, and is up 4.9% YoY. This resumes the pattern of slow deceleration since the end of the pandemic lockdowns, and is the lowest since early 2021. Nevertheless in real inflation adjusted terms this remains powerful evidence that average working families have continued to see gains in “real” spending money.

Other significant data:
  • Professional and business employment rose 9,400 to the highest number since July. These tend to be well-paying jobs. Their YoY comparison, however, remained 0.4%, which in the past 80+ years has almost always happened immediately before, during, or after recessions. 
  • The employment population ratio rose 0.2% to 60.0%, vs. 61.1% in February 2020.
  • The Labor Force Participation Rate remained steady at 62.5%, vs. 63.4% in February 2020. The prime 25-54 age  participation rate declined -0.1% to 83.4%, vs. its all time peak of 83.9% in June and July.


SUMMARY

Needless to say, in the main this report was strongly positive, as all the headline numbers moved in the right direction. There was also good news in aggregate payrolls, in the construction sector, and in the previously suffering professional and business as well as temp jobs sectors. The native born unemployment rate continues to be consistent with the very low initial jobless claims numbers we’ve been seeing each week. 

As I noted above, the leading indicators in the survey were mixed, as construction continued to power forward, and short term unemployment declined; but on the other hand, manufacturing continues to suffer and the goods producing sector as a whole has failed to make a new high for the past 3 months. Although this is hardly dispositive, it is a red flag. Meanwhile real wages remained positive, but this too has continued to decelerate. Much depends on the immediate future course of inflation.

But to return to my main theme, this month was consistent with the “soft landing” scenario, although the longer term trend of deceleration has not been broken. And because of Holiday seasonality, take it with an extra grain of salt.

Thursday, January 9, 2025

Jobless claims still rocked by seasonality; native born unemployment rate of under 4% forecast


 - by New Deal democrat


Due to today’ official Day of Mourning for the late President Jimmy Carter, initial and continuing claims were released yesterday, but since I didn’t cover it then, let’s catch up now on the normal day.


It is important to note right off the bat that the two weeks after Christmas and New Year’s are those most affected by seasonality, and are extremely difficult to adjust for. So the numbers need to be taken with liberal helpings of salt. In particular, for the last two years the pattern has been steep declines to annual lows those two weeks, followed by an increasing trend - probably also a leftover from the distortions of the pandemic years.

That being said, initial claims declined another -10,000 to 201,000, their lowest number since last February. Similarly, the four week moving average declined -10,250 to 213,000, their lowest print since April. Continuing claims, with the usual one week delay, rose 37,000 to 1.867 million, in line with their numbers for the past several months:


Given the outsized effect of seasonality this week, the YoY% changes are all the more informative. On that basis, initial claims were up 1.5%, the four week moving average up 4.4%, and continuing claims were up 6.1%:


These are all neutral readings, telling us the economy continues to expand, but at a much more attenuated pace than even earlier 2024.

Finally, here is our final look at what jobless claims are forecasting for the unemployment rate:


Absent the strong effects of the surge in new immigrants post-COVID, claims continue to suggest downward pressure on the unemployment rate. Indeed, the Household Survey does break out the unemployment rate by native born (dark blue in the graph below) vs. foreign born (light blue), and you can see that the significant increase in the latter has been primarily responsible for the outsized increase in the unemployment rate:


If we compare initial claims with just the native born unemployment rate, the figures track much more closely, with the exception of last January and February:


In any event, on a monthly basis, initial claims were roughly 7% higher YoY, and continuing claims up 3.5%. Since one year ago the unemployment rate was 3.7%, a 3.5% to 7% increase in that rate (as usual, note that we are calculating a percent of a percent) brings us up to 3.8%-4.0%, which is lower than the 4.2% we saw last month - but right in line with the native born unemployment rate of 3.9%. We’ll find out tomorrow!

Wednesday, January 8, 2025

Truck sales sound a warning


 - by New Deal democrat


Twenty years ago Prof. Edward Leamer made a big splash with a speech to the Fed in which he proclaimed that “Housing IS the Business Cycle,” highlighting how downturns in the housing sector tended to lead recessions by an average of 7 quarters. For today’s purposes, though, I want to focus on his conclusion, which was that after housing turned down, the next sector that turned down was durable goods spending by businesses.


An excellent barometer of durable goods spending by businesses in the past has been their purchase of heavy weight trucks. While car and light truck sales have been very noisy, sales of heavy weight trucks have had a very good record of turning down by -10% or more well before recessions, with the sole exception of 1970 (averaged quarterly in the graph below):


Which of course brings me to the latest data. For some reason FRED does not update their graph until several weeks after the BEA publishes the data, so let me tell you that in December seasonally adjusted sales of heavy trucks were .422 million annualized (light blue in the graph below). For the 4th quarter, on average, sales were .459 million (dark blue). As the below graph, which norms both values to 0 shows, each of these were the lowest such number, in 2 1/2 years:


Now let’s bring Prof. Leamer’s paradigm into the mix. Below I show the entire history of housing permits (red, left scale) vs. heavy weight truck sales (blue, right scale):


With the sole exceptions of the pandemic and the 1981 Fed-induced “double dip,” housing permits have not only always turned down before recessions, but also peaked before heavy weight truck sales. The lag time is very variable, but the median is about 6 months. 

Now let’s zoom in on that same graph for the last five years:


Housing permits peaked at the beginning of 2022. Heavy truck sales did so in early 2023. Permits took another small leg down since early 2024. I am very reluctant to rely on one month alone, but the suggestion from the three month average is that heavy truck sales may be doing the same thing now.

Per Leamer’s theory, the next domino to fall would be consumer durable goods orders. As the below graph shows, the broad measure of such orders appears to have peaked in spring 2024, but car and SUV purchases have continued to increase (again, December is not shown, but was actually higher than November at 17.1 million annualized):


It’s important to state that recessions are not about the *level* of data like sales, but rather their *trend.* Both housing and truck sales have continued down into the first part of recessions in the past. Housing permits were relatively stable during 2024. It may yet be the case with one or two months of data that heavy truck sales have stabilized at a lower level as well.

Still, that heavy truck sales may be sounding a warning is an added reason to keep an eye on all of the components of goods-producing employment when Friday’s employment report for December comes out, because if the downturn has spread to employment in the goods sector, odds of a recession in 2025 have risen indeed.

Tuesday, January 7, 2025

November JOLTS report adds to the data showing continued labor market deterioration


 - by New Deal democrat


The second of this morning’s reports was the JOLTS survey for November. 

Like many other statistics concerning jobs, the JOLTS series have been deceleration for several years. The question now is whether they level off or continue to decelerate towards outright declines in net job creation. Additionally, it is a slight leading indicator for both initial jobless claims and unemployment; and for wage growth as well.

In contrast to the economically weighted ISM reports I discussed earlier this morning, in November as has so often been the case in 2024, the JOLTS data was mixed, with a downward bias. The soft statistic of job openings rose to a five month high, but the hard data of hires, quits, and also layoffs and discharges declined. The below graph norms the series above (expect for quits) to 100 as of just before the pandemic:


Both actual hires, as well as quits, turned weaker than their pre-pandemic levels a little about one year ago, while openings remain higher. The trend in openings has been lower, and I suspect that the improvement in the past two months is likely to prove to be just noise.

Showing the same data as YoY% changes tells us that there has been no significant change in the decelerating trend; in other words, there remains no evidence that there has been any leveling off:


The news on layoffs and discharges was also not so good. That’s because, in addition to rising in November, October’s very good number was revised significantly higher. This suggests that the YoY increases in initial jobless claims that we have seen during December have not been a fluke, and are more likely than not to continue:


Finally, although I’ll spare you the graph this month, the quits rate (blue in the graph below) has a record of being a leading indicator for YoY wage gains (red). In the post-pandemic view, the quits rate stabilized earlier in 2024 before resuming its decline, and in November it tied September for its post-pandemic low:


This suggests that on a YoY basis wage gains will continue to decelerate as well. If inflation stabilizes or picks up again, this could create a problem later this year - and if the overall trend of the JOLTS data continues, so will it.

Economically weighted ISM indexes for December forecast continued expansion


 - by New Deal democrat


We got two significant economic releases this morning. First, let’s take a look at the ISM services index. I’ll examine the November JOLTS report separately.


Recall that services are about 75% of the economy. Thus, even if goods production is contracting, their share of the economy has declined to the point where that does not necessarily mean a recession is in the offing. So I average both ISM indexes by their economic weights.

And the ISM services report for December came in strong once again. The total index was at 54.1, well into expansion territory, similarly the more leading new orders component (not shown) was at 54.2:


The three month average of each is 54.1 and 55.1 respectively.

Since the ISM manufacturing index improved last week to 49.3 for the total index and 52.5 for the new orders component, and their respective three month averages are 48.1 and 50.0, the economically weighted average of the two for December is 52.9, and the new orders component is 53.8. Their respective three month averages are 52.6 and 53.8.

In short, the economically weighted average of the ISM indexes forecasts continued economic expansion in the months ahead.

Monday, January 6, 2025

2024 year end Coronavirus dashboard: the year COVID-19 turned into the flu


 - by New Deal democrat


A year ago I said that I would only update information about the state of COVID-19 if there was something significant to report. And as of the end of the year 2024 there is: deaths from COVID in 2024 have fallen to the point where they are equivalent to the upper end of a “normal” flu year. Because for the entire year they are likely to have been under 50,000.


This is an absolutely huge improvement over the first several years of COVID, and even much better than 2023. Let me review, first graphically, then with a few numbers.

Here is what the entirety of weekly deaths from COVID look like all the way back to the start of the pandemic:


You can see that deaths during 2020 and 2021 were much higher than in any of the three years since. But that’s not all.

Because when we take out the first two years, and only look at the last three, we can see that the substantial decline in deaths has continued in each year:


To quickly review, here are the deaths for each calendar year (keeping in mind that the numbers only begin at the end of March 2020):

2020: 393.0 thousand (9.2 months; 512.6 thousand annualized)
2021:  455.9 thousand
2022:  243.9 thousand
2023:  75.6 thousand
2024:  46.1 thousand

Since the data for the last three weeks of 2024 is only preliminary so far, it is likely that another 1,000 to 1,500 deaths will be added to that total, making it 47.1-47.6 thousand when final.

According to the CDC, deaths from the flu typically average between 12,000 and 51,000 annually. So this year’s total for COVID will be within that range. In fact, for the last 52 weeks of final data through December 7, there were 51,200 deaths - only 200 above the CDC’s average range - and the 52 week total has been declining by close to 1,000 since the beginning of October.

The pattern is similar when we look at infections as measured in wastewater. The original Omicron variant peaked at 23.6 particles per mL. One year later the Holiday peak was 10.99 particles. Last year at this time the peak was 13.23 particles:


Now let’s zoom in on the last 12 months. With one week left to go in 2024, there are only 4.75 particles per mL:


Although a number of States did not report through the Holiday period, meaning the estimates in the gray shaded area to the far fright are likely to be revised higher, It’s likely that the Holiday peak which should occur this week will see something like only about 6.0 particles per mL - not just only 1/2 of last winter’s peak, but under this past summer’s peak as well.

It looks like the decline in COVID can be attributed to three factors: (1) the % of people who have had one or usually multiple vaccinations; (2) the % of people who have developed some resistance by having been infected one or more times; and (3) the virus, as one expert put it, having “evolved itself into a corner.”

What does the last factor mean? For that, let me show you the following graphic from the CDC’s variant frequency site:


Every single variant currently in circulation evolved from the original Omicron variant, via BA.2, then BA.2.86, then JN.1, and finally JN.1.11.1. All the other lineages have been out-evolved and have died out.

A similar thing happened with the flu. Every single flu variant in the past 100 years has been a descendant of the original “Spanish flu” which was so deadly during and after World War 1. The original death toll declined over time to the “normal” range I cited above. That, by the way, is why scientists are so concerned about the new bird flu. If it makes the full jump to human to human transmission, it will be the first entirely new flu strain separate from that of the past 100 years.

In the meantime, we can breathe something of a sigh of relief, and hope that COVID-19 continues to wane over time.

Saturday, January 4, 2025

Year end Weekly Indicators at Seeking Alpha


 - by New Deal democrat


My “Weekly Indicators” post is up at Seeking Alpha.

Both the long leading and short leading indicators have weakened in the past two weeks. The former is due to the short end of the Treasury yield curve re-inverteg. The latter is due in part to continued weakness in new jobless claims, but mainly to commodities weakening, and the flip side of that coin, a major strengthening of the US$. Here’s a graph of the US$:


As you can see, it made new all-time highs this week against other currencies (blue, right scale), and has surged YoY by well over 5% (red, left scale), one of the strongest moves in the past 20 years.

When the US$ increases sharply like that, imports get cheaper and exports suffer. This negatively affects GDP. Starting new trade wars obviously won’t exactly help that situation.

As usual, clicking over and reading will bring you up to the virtual moment as to the state of the economy, and reward me with some lunch money.

Friday, January 3, 2025

ISM manufacturing index improves in December, signaling near term continued economic expansion


 - by New Deal democrat


Unusually this month, the ISM manufacturing index was delayed one day after the first business day of the month. In other words, it was released this morning instead of yesterday.

In any event, a refresher that because manufacturing is of diminishing importance to the economy, and was in deep contraction both in 2015-16 and again in 2022 without any recession occurring, I now use an economically weighted three month average of the manufacturing and non-manufacturing indexes, with a 25% and 75% weighting, respectively, for forecasting purposes.

In the indexes, any number below 50 indicates contraction. It used to be the case that numbers below 48 indicated recession. Now the ISM says that any number above 42.5 is consistent with expansion. 

In December, the total index rose 0.9 to 49.3, while the more leading new orders subindex improved 2.1 further into expansion territory at 52.5. 

Including this month, here are the last six months of both the headline (left column) and new orders (right) numbers:

JUL. 46.8. 47.4
AUG 47.2. 44.6
SEP 47.2. 46.1
OCT 46.5. 47.1
NOV  48.4. 50.4
DEC 49.3. 52.5

Here is what the total index looks like graphically for the last three years:


And here is the graph of the last three years for the new orders subindex:


The three month average for the manufacturing index is 48.1, and for the new orders component 50.0. For the past two months, the average for the non-manufacturing headline has been 54.0 and the new orders component has been 55.5. Thus, unless the non-manufacturing index for December completely tanks when it is reported on Monday, the combined indexes strongly suggest continued expansion for the next few months.

Thursday, January 2, 2025

More worrisome signs as construction spending, especially for residential construction, declines with negative revisions


 - by New Deal democrat


Last month I started by report on construction spending by writing “ Construction spending for October also came in generally positive. On a nominal basis, total construction spending rose 0.4% to a new record, and residential spending rose 1.5%.”


Well, you can forget that, because this month was one of those times when revisions to past data make all the difference.

On a nominal basis, total construction spending was unchanged, while residential construction spending rose 0.1%. But total construction spending for both September and October was revised downward by 1.0%. The carnage in residential construction spending was even worse, with both September and October revised down by -3.2%! Thus what was a (surprising) rising trend line for residential construction spending in particular was completely reversed, as shown in the graph below:


As revised, even nominally both series peaked in May of 2004.

The prices of construction materials were declining through September, making real construction spending even better. But that has reversed as well, with prices rising in both October and November, making the “real” declines in the nominal graph above even steeper:


This is particularly worrisome, because manufacturing has been in a slight downtrend for two solid years. Thus it has been construction which has been aiding improvement in the economy since then. If construction has also rolled over, then goods production as a whole - and employment in goods production - are probably close behind. As to which, recall that employment in construction and goods production generally lag construction and sales. Thus if they have rolled over, employment will likely follow - and indeed in last two months, such employment has been below September’s peak.

Typically the ISM manufacturing survey is reported on the same day as construction spending. This month that is not true, as the ISM index will be reported tomorrow. If it continues to show contraction, that is trouble.
The final jobless claims report of 2024 is good weekly, but the trend indicates substantial weakening


 - by New Deal democrat


Welcome to 2025! The data this year starts out with jobless claims for the last week of 2024, which of course is heavily influenced by seasonality.


The news was mainly good this week, with claims declining -9,000 to 211,000, the lowest number in over half a year. The four week moving average, which is particularly important in the midst of Holiday seasonality, declined -3,500 to 223,250, about average for the past six weeks. With the typical one week delay, continuing claims declined -52,000 to 1.844 million:


As usual, the YoY% comparisons are more important for forecasting purposes, and here the news is not so good. Initial claims were higher by 6.6%, and the four week moving average by 8.5%. Continuing claims were also higher by 1.6%:


The poor comparison of the four week moving average is particularly noteworthy, because, excluding the hurricane affected weeks of early October, it is the worst YoY read since September 2023. It is *not* recessionary, since it has not even crossed the 10% threshold, and I would need to see it remain above that threshold for a sustained period of time. But it does indicate a significant weakening of the employment situation.

The jobs report for December won’t be released for another week, but we now have almost all the information we will have to compare with the unemployment rate, which typically follows jobless claims. The below graph presents the YoY% of the data, which in the case of the unemployment rate, becomes a percent change of a percent:


The immigration situation makes this particularly hard to read. The best I can say is that, absent effects from the surge in immigration in the past several years, the unemployment rate probably would not have increased over 4.0% this summer, and even the present initial claims monthly averages forecast an unemployment rate in the range of 3.9%-4.1%. Anything above that is likely due to the continued effects of the immigration situation.

Tuesday, December 31, 2024

Repeast sales ouse prices show signs of re-acceleration in the last data of 2024


 - by New Deal democrat


I was on vacation through the weekend, and since there has been no significant economic data in the post-Christmas lull, I decided to continue to play hooky. After tomorrow, on Thursday the 2025 data will start in earnest, so expect a return to form later this week.

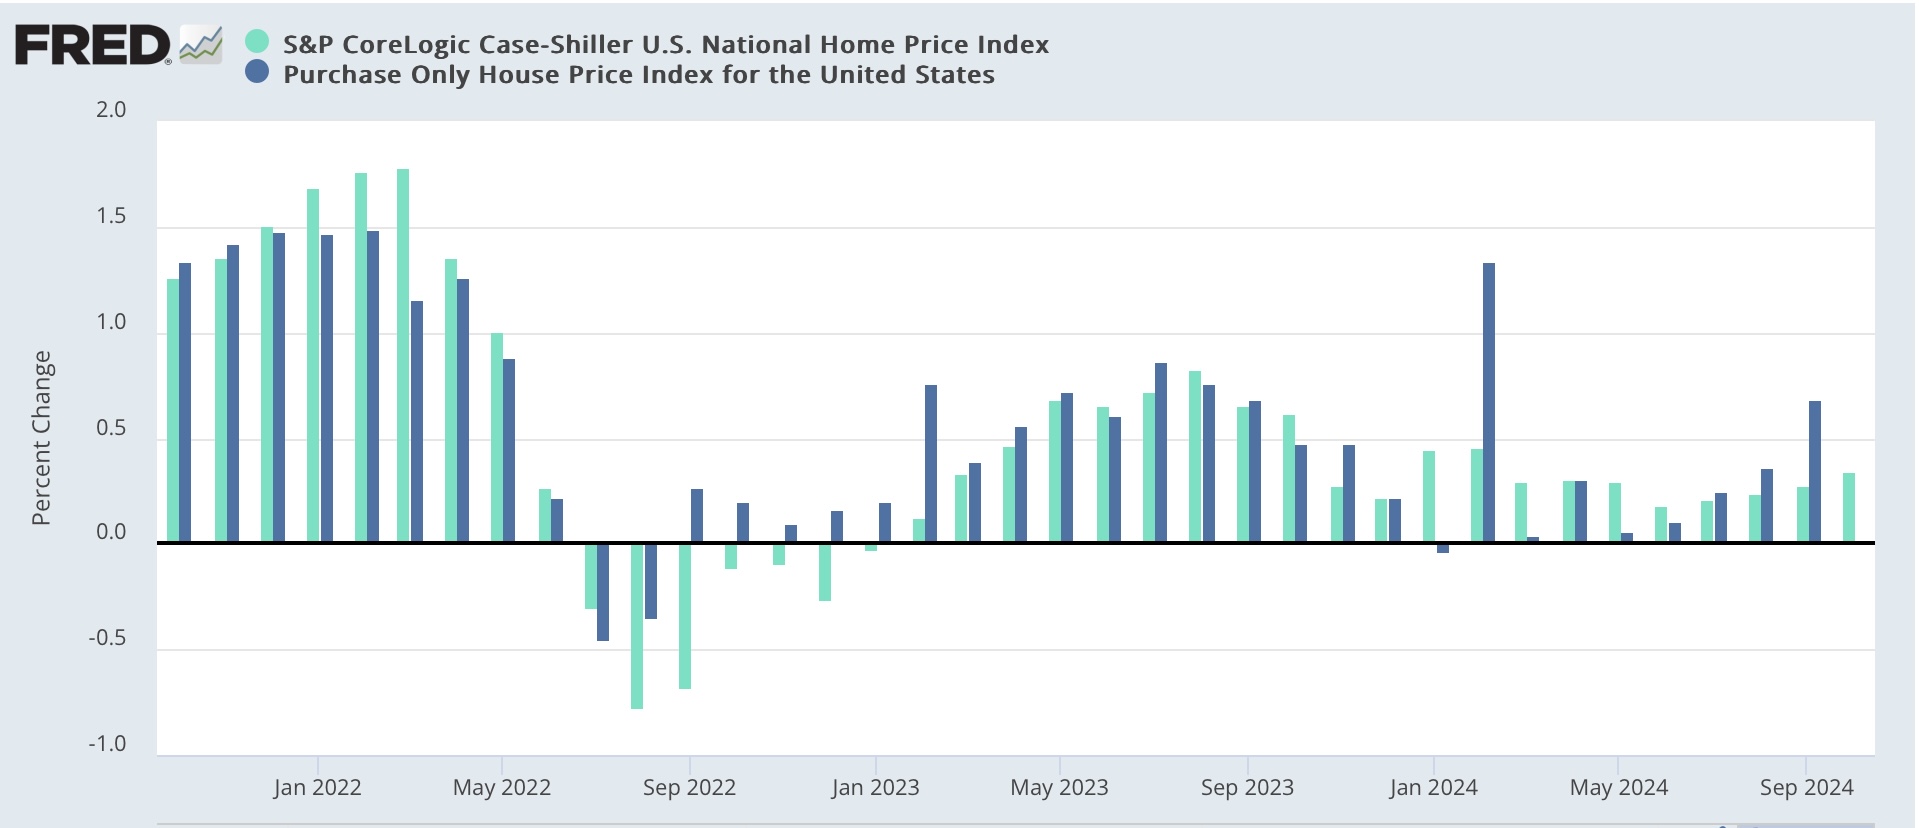
In the meantime, this morning’s repeat house price indexes from the FHFA and Case Shiller show a somewhat worrying re-acceleration in house price appreciation. Specifically, on a seasonally adjusted basis, in the three month average through October, U.S. house prices according to the Case-Shiller national index (light blue in the graphs below) rose 0.3%, and the somewhat more leading FHFA purchase only index (dark blue) rose 0.4% [Note: FRED hasn’t updated the FHFA data yet]:


On a YoY basis, the Case Shiller index decelerated to a 3.6% gain, while the FHFA index accelerated slightly to a 4.5% YoY increase:


Finally, because house prices lead the measure of shelter inflation in the CPI, specifically Owners Equivalent Rent by 12-18 months, we can use this morning’s data to calculate its trend which is 25% of the entire CPI. Despite the increase in the YoY reading in the FHFA in the past several months, this indicates that OER should continue to trend towards 3-3.5% YoY increases in the months ahead:


The deceleration in OER has been very slow, but has finally fallen below 5.0% YoY. The most leading rental indexes, including the Fed’s experimental all new rental index, indicate that YoY rent increases should decline further, which adds to the evidence for continued deceleration in that huge component of consumer price inflation.

Additionally, because prices generally follow sales, and existing home sales have been stagnant for almost 2 years, while new home sales have only increased slightly:


this also suggests that there is very little in the way of increased price pressure in the housing market going forward into 2025. Indeed, although I won’t bother with the graph, the median sales price for new houses has continued to *decrease* in the past year.