- by New Deal democrat
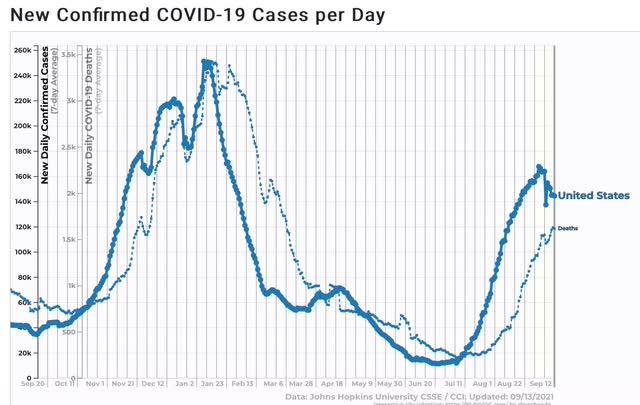
I have been saying for some time that the Delta wave would probably peak around Labor Day. It’s not certain yet, but it is looking increasingly likely to have been the case.
The Delta wave struck in both the US and Israel at almost the same time, with almost the same vaccination profiles. Here’s what cases per capita (bold lines) and deaths per capita (dotted lines) look like for each:
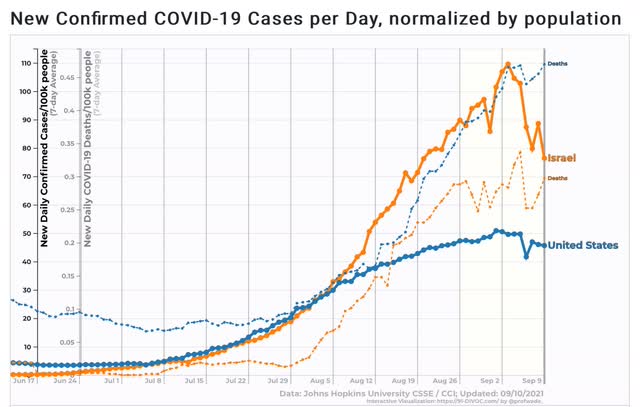
Cases in both countries appear to have peaked in the last week (repeating the pattern in the Delta waves in India, the Netherlands, and the UK). Deaths have either stabilized or (more likely) are still slowly increasing.
Data in the US was affected by the Labor Day weekend. Here is the daily count of cases for the last 4 weeks in the US:
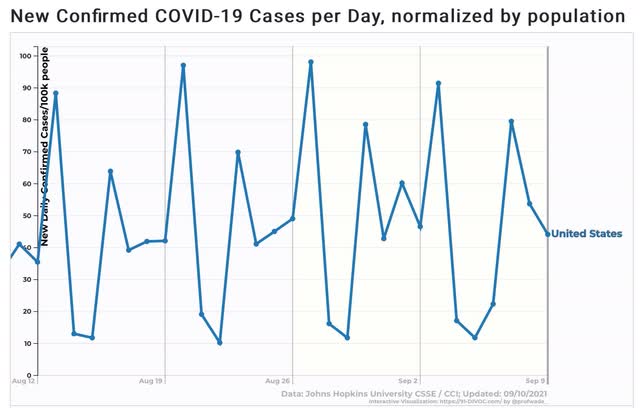
Note the difference in last Monday and Tuesday, the 6th and 7th, compared with the prior three weeks. The weekly average of cases is down from one week ago because the two days combined did not have as many cases reported as in the previous week. So we won’t have a real measure until next Monday’s and Tuesday’s cases are reported for comparison.
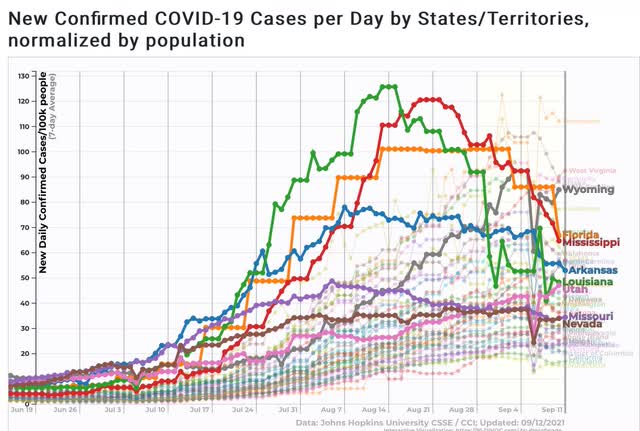
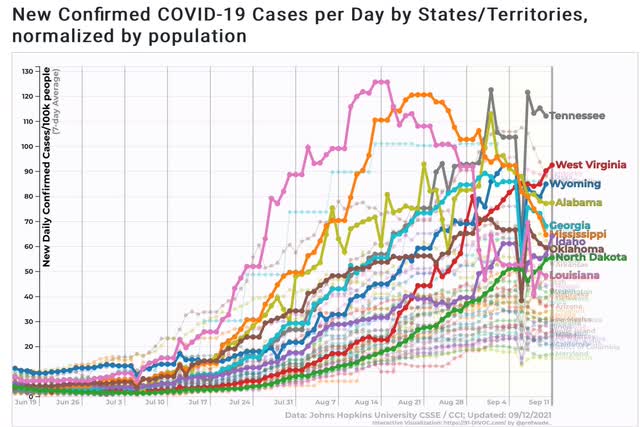
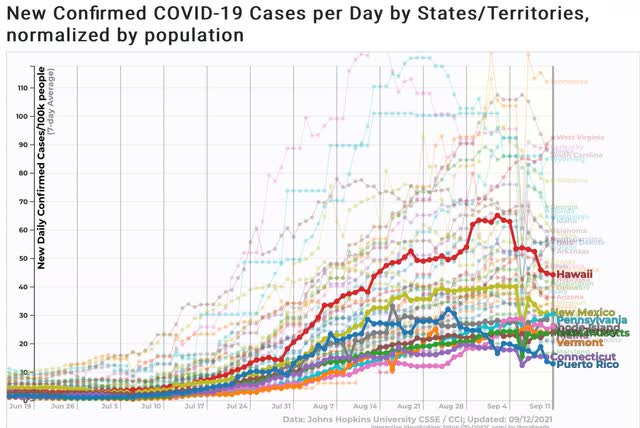
Some further good news is that there is a clear uptrend in only 10 States, of which 9 are relatively small and/or rural. In the remaining State, Pennsylvania, the uptrend is quite small:
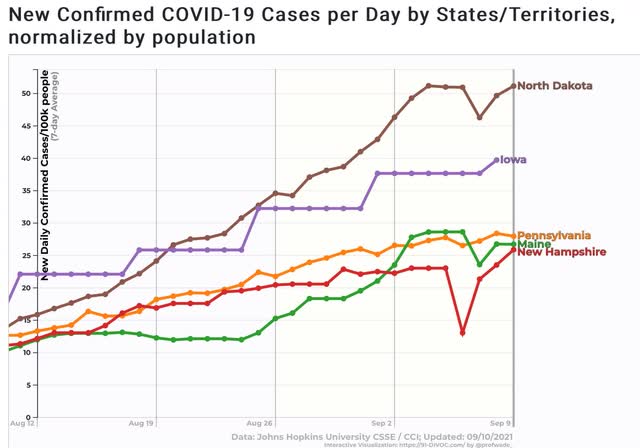
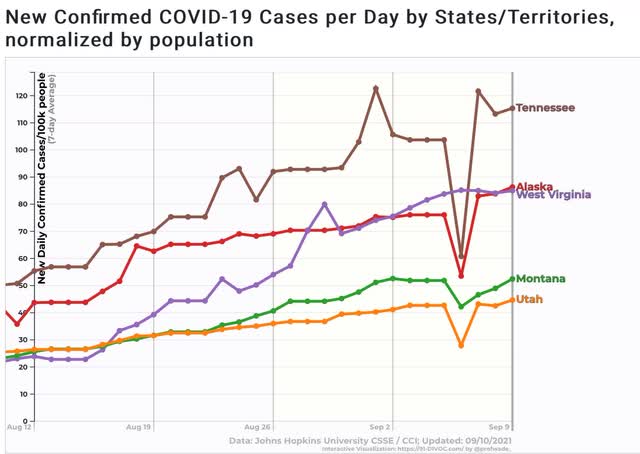
Once again, we will have to wait for next week to see if this was just an artifact of Labor Day or holds up.
But if we are at or have just passed the peak of the Delta wave, now is a good time for a quick review of my forecasting of the Delta wave, which began back in June, while national case counts were still declining, here and here, when I said
As the “Delta” variant becomes more widespread in the next 4 to 8 weeks, it will be a real challenge for the relatively unvaccinated States
And further that:
If Missouri’s rate continues to rise (and, as we’ll see below, there is every reason to expect that to happen), then COVID is going to burn through Missouri’s (and other similarly situated States’) population in the next few months like a forest fire exploding uphill.
If these States’ trends continue - and there is no reason to think their populations are going to change their minds about vaccines, masking, or social distancing at this late date - then they will be in the thick of a “Delta wave” in about 2 to 4 weeks, with many other States in the Deep South and interior West close behind
By early July, right as the upturn in cases was beginning, I wrote:
The bad news is that the “delta wave” is spreading, and we should expect a real outbreak on the order of last summer’s by early August. The *relatively* “good” news is that the death rate is likely not to be nearly so bad, if the experience in the UK is any guide.
And also:
“I expect the situation for all of the above States [AR, MO, NV, and FL], except possibly Arizona, to change considerably for the worse before the end of this month.”
And also:
“If the US follows the same course as the UK, 1 month from now the US will have about 1000 deaths per day.”
And also:
“So, brace yourselves. Cases have nearly tripled in the US over the past 2 weeks. Deaths are likely to increase to nearly 1000/day over the next 2 to 4 weeks.”
By the end of July, I was looking for when the peak would occur:
“It seems pretty clear that Delta burns through the dry tinder very fast - on the order of 9 to 12 weeks from onset to peak, based on the experience of the UK and India, respectively. The US is 7 weeks past its trough in cases, so it is a fair hypothesis that the Delta wave will reach its peak at some point in the next 2 to 5 weeks - roughly at some point in the second half of August or early September.”
And again in early August:
“from prior trough to peak took 12 weeks in India, and 9 weeks in the UK. During that time, in India *confirmed* cases rose 35x. In the UK it was 25x. Seven weeks in, the US has seen an 8x rise in cases.”
[Note: last week, the US had seen a 14-fold increase in cases from the end of June trough.]
And also here. And then two weeks ago:
“So if the pattern continues, it looks like the Delta wave is about 1 week from peaking - I.e., right about and maybe a little before Labor Day.”
Since no critical self-analysis would be correct without acknowledging my misses, one area where I was wrong, at least early on, was based on the seropositivity report out of India that during the Delta wave over 50% of the population had been infected, based on seropositivity samples.
So in the late July note I referenced above, I wrote:
“If we use the UK and India as our range, when it comes the peak in the US will be about 280,000 to 400,000 cases/day!
“If I am correct that Delta is going to infect at least 50% of the US’s unvaccinated population over about the next month, then the remainder of this month and September are going to be brutal. But if about 70% of US adults are fully vaccinated by then, and over half of the rest have antibodies due to recent Delta infection, then with over 85% of US adults immune either the easy or the hard way, by late this autumn there may an actual return to near-normal life.”
Based upon the same estimate that 50%+ of the population had been infected in India, I also initially specter cases to rise right into October.
This was wildly high (at least so far!). Trevor Bedford, who wrote in July that he expected Delta to infect about 35 million people before the wave was over, looks to have been closer to the mark. Since the end of June there have been a little over 7 million *confirmed* new cases, with at least as many so mild or asymptomatic as to never have been confirmed by testing. If the wave recedes as quickly as it hit (a *very* optimistic scenario), that would total about 28 to 30 million cases in total.
So where do we go from here? One month ago I wrote:
“Once Delta burns through the dry tinder nationwide, which is looking more and more to happen sometime around Labor Day, just what % of all Americans have actually been infected by COVID becomes determinative in what is likely to happen next.”
Since early July about 20 million people, or 7% of the US population, have become fully vaccinated. If that rate continues over the next 2 months, then 60% of the total US population will have been fully vaccinated. If Delta infects a total of 30 million since its onset, in addition to the estimated 20% previously infected, that gives us a total of 30% of Americans with antibody resistance of some efficacy. If those 30% are randomly allocated between vaccinated and unvaccinated, this gives us a total of about 72% of Americans with either vaccine or natural resistance as of the end of October. Not enough for herd immunity, but certainly enough to limit the prevalence of the next wave.
Additionally, with the Biden Administration, and some States and localities taking tougher measures to mandate vaccinations - and here I am particularly thinking of the LA School District’s mandatory vaccination policy, which I suspect will spread like wildfire to many other large urban school districts - we are likely to get a boost of at least a few more % of vaccinations among the populace.
So, with full understanding that there are lots of unknowns, my best guess as to the near future is:
1. We are at or have just passed the peak of the Delta wave.
2. Cases will decline, but at a rate much slower than at which they rose in July and August, as school openings, autumn sports, and increased indoor gatherings in the North give Delta some new dry tinder to burn through.
3. Another late autumn and winter wave looks likely, but not nearly as bad as last winter’s, and probably not as bad as this summer’s Delta wave; and it will remain a wave very much concentrated on the vaccine holdouts who manage to dodge the various mandates that are likely to increase sharply.