Monday, September 7, 2015

Five graphs for 2015: Labor Day update with 4 bonus graphs


 - by New Deal democrat

At the end of last year, I highlighted 5 graphs to watch in 2015.  We are now 8 months through the year, so let's take another look.

#5.  Mortgage refinancing


After a mini-surge at the end of January (light brown in the graph below) due to low mortgage rates, refinancing applications fell back to their post-recession lows for most of the year.  With another small decline in rates in the last 2 months, there has been a "minnier"-surge Mortgage News Daily has the graph:


Over the last 35 years, refinancing debt at lower rates has been an important middle/working class strategy.  There is little room left for that strategy.  As shown in the first bonus graph below that I first published over 3 years ago, if mortgage refinancing stays turned off too long, and wages don't grow in real terms, then consumer spending falters and so does the economy:


That three year anniversary is now 2 months away.  

 #4 Gas prices

Here is a graph of average hourly wages divided by gas prices (blue) since the bottom in gas prices in  1999: 


How long must a worker labor in order to buy a gallon of gas?  After skyrocketing in the lead-up to the Great Recession, gas prices collapsed, helping the consumer start to spend again on other things at the bottom of that recession.  The steep drop in gas prices late last year took us almost all the way back to that bottom.  Just as in 1986 and 2006, at first consumers saved the money, but once they loosened their pursestrings, the economy responded.

#3 Part time employment for economic reasons

 Next is a graph of part time workers for economic reasons expressed as a percentage of the labor force.  In the 8 months of this year, this continued to improve, down about .2% or 320,000:


In the longer view, however, this is  still 2% (about 3.2  million) above the boom level of 1999 and about 1.5% (2.25 million) above the level of 2007: 


Despite the solid improvement this year, there are still more involuntary part time workers than at any  point between 1994 and 2008.

Our next bonus graph takes a broader view of full time vs. part time work, as a percentage of the  labor force:


There  has also  been solid improvement in this comparison this year.  We are now equivalent to where we were in 1996 and 2004.  That isn't great, but it is no longer poor either.

Our third bonus graph shows that the number of full time jobs have finally exceeded their previous high this past month:
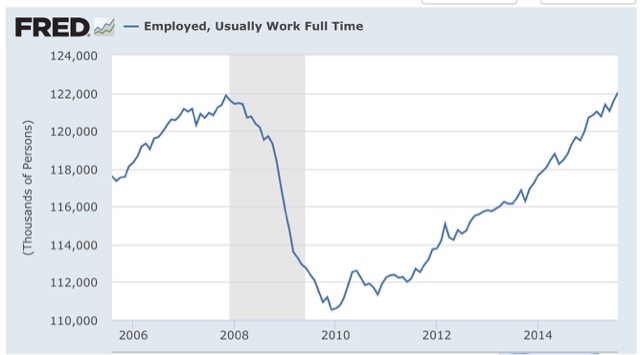


#2 Not in Labor force but want a job now:

This moved generally sideways during the first quarter, but improved nicely in the last four months:


It is now only 200,000 above its post-recession low of November 2013 (just prior to Congress's cutoff of extended unemployment benefits) and about 1.5 million, or 1% of the workforce, above its 1999 and 2007 lows.

 #1 Nominal wage growth 

After 3 poor readings last August, December, and February, YoY growth in nominal wages for nonsupervisory personnel fell  back close to their post-recession lows before rebounding this spring.  Even so, YoY growth has been unable to crack 2% to the upside.  In the below graph, I have s ubtracted 1.9% fromYoY nominal wage growth, and 10.3% fromcthe U6 unemployment rate, to set both to zero at their current levels:  


Compare our present expansion with the previous two.  In the 1990s and 2000s, nominal wage growth started to accelerate when the broad U6 unemployment rate fell to 9.9% and 9.7% respectively.  

Which brings us to the final bonus graph, a comparison of the U3 and U6 unemployment rates for the last 20 years, again with both values set to zero at their current 10.3% and 5.1% values:


The broad U6 unemployment rate has fallen at an average of -0.1% per month for the last 5 years.  Should that continue, we will cross below 10% at the end of this year, implying nominal wage growth would finally accelerate early next year. Since at present inflation is still dead, one can only infer that the Fed's expressed desire to raise interest rates is designed to prevent any such wage growth.

 In summary, eight months into the year we have a decidedly mixed bag. On the one hand, there  has been no real improvement in either refinancing or  wages. Should wage growth not improve, and mortgage refinancing remain dormant, we are likely to run into trouble - at least deceleratiing growth - probably starting next year. 

On the other hand, low gas prices continue to be a boon to consumers.  Further, involuntary part time  employment has improved by about 300,000, and discouraged workers who have completely stopped looking have decreased by about 500,000. Thus, should those  trends continue, I do expect wage growth to start to accelerate in about 3 to 6 months.  Still,  if current trends continue, we won't achieve real, full employment like 1999 or even  2007 for another 1.5 to 2.5 years! 

Saturday, September 5, 2015

Weekly Indicators for August 31 - September 4 at XE.com


 - by New Deal democrat

My Weekly Indicators post is up at XE.com.

This week particularly highlighted the bifurcation between those parts of the US economy most exposed to the global slowdown, and those most focused on domestic consumption.

International Economic Week in Review

This is over at XE.com

Friday, September 4, 2015

August jobs report: Meh headliine, great internals except wage growth still stinks


- by New Deal democrat

HEADLINES:

  • 173,000 jobs added to the economy
  • U3 unemployment rate fell -0.2% to 5.1% 
With the expansion firmly established, the focus has shifted to wages and the chronic heightened unemployment.  Here's the headlines on those:

Wages and participation rates
  • Not in Labor Force, but Want a Job Now: down -203,000 from 6.135 million to 5.932 million
  • Part time for economic reasons: up  158,000 from 6.325 million to 6.483 million
  • Employment/population ratio ages 25-54: up 0.1 from 77.1% to 77.2% 
  • Average Weekly Earnings for Production and Nonsupervisory Personnel: up +0.2% from $21.02 to $21.07,  up +1.9%YoY. (Note: you may be reading different information about wages elsewhere. They are citing average wages for all private workers. I use wages for nonsupervisory personnel, to come closer to the situation for ordinary workers.)
June was revised upward by +14,000.  July was also revised upward by +30,000, for a net change of +44,000.

The more leading numbers in the report tell us about where the economy is likely to be a few months from now. These were very positive.

  • the average manufacturing workweek rose 0.1 hours from 41.7 hours to 41.8 hours.  This is one of the 10 components of the LEI and so will affect it positively.
  •  
  • construction jobs increased.by 3,000.  YoY construction jobs are up 217,000.  

  • manufacturing jobs decreased by -17,000, and are up 128,000 YoY.
  • Professional and business employment (generally higher-paying jobs) increased by 33,000 and are up  643,000 YoY.

  • temporary jobs - a leading indicator for jobs overall - rose by 10,700.

  • the number of people unemployed for 5 weeks or less - a better leading indicator than initial jobless claims - fell by -393,000 from 2,488,000 to 2,095,000, making a new low for this expansion.

Other important coincident indicators help us paint a more complete picture of the present:

  • Overtime fell -0.1 hour from 3.4 hours to 3.3 hours.

  • the index of aggregate hours worked in the economy rose by 0.4 from a downwardly revised 103.6 to 104.0. 
  •  
  • The broad U-6 unemployment rate, that includes discouraged workers declined  -0.1% from 10.4% to 10.3%. 
  •  the index of aggregate payrolls rose by 0.9% from a downwardly revised 123.7 to 124.6.
Other news included:    
  • the alternate jobs number contained in the more volatile household survey increased by  196,000 jobs.  This represents an increase of 2,585,000  million increase in jobs YoY vs. 2,919,000 in the establishment survey.  

  • Government jobs rose by +33,000. 
  • the overall employment to population ratio for all ages 16 and above rose +0.1%  from 59.3% to 59.4%,  and has risen by +0.1% YoY. The labor force participation rate was unchanged at  62.6% and is down -0.3% YoY (remember, this incl udes droves of retiring Boomers). 

SUMMARY:


Only two things held this report back from being Totally Awesome! The first is the headline 140,000 private jobs created, but as most readers probably already know, August numbers have had a history of major upward revisions.  The second - sigh - once again is wage growth, which despite a 5.1% U3 unemployment rate is unable to crack 2%.  This is terrible and continues to bode ill for the next recession whenver it may come.  I still expect this situation to improve once the broader U6 unemployment rate, which fell again this month, finally falls below 10%.

Everything else was damn near, well, awesome. Not only did both unemployment rates fall to new lows, so did short term unemployment (a leading indicator), and those not in the labor force but want a job now fell to a new post-recession low save for one month.  Involuntary part time workers did go up, but still are at the second-lowest number since the recession. The manufacturing workweek improved Manufacturing and mining employment did fall, but were more than offset by gains elsewhere. Both aggregate hours and payrools also made a new post-recession high.

All in all, a good report.

Thursday, September 3, 2015

US consumers power past poor manufacturing


 - by New Deal democrat

I have a new post up at XE.com, contrasting the slowdown in US manufacturing vs. the strength of the US consumer economy.

A real puzzle about real wages


 - by New Deal democrat

This morning the National Employment Law Project (NELP) released its annual update on real wages during the recovery.  Their findings are a puzzle to say the least. 
Virtually every other measure of real wages shows a bottom in late 2012. (Real wages declined from 2009-12 as the price of gas went from $14.0 to $3.90, hence inflation outstripped miserly nominal wage growth):

In contrast, here is the NELP graph of real occupation wage changes from 2009-2014:

Note that the OES is calculated through May of each year, so the latest report misses the effect of the big decline in gas prices in the last 12 months. 
It is virtually gospel that as the labor market improves, so should wage growth. In other words, wages could be down from 2009, but up from 2012 or 2013. So I went back and compare the NELP's latest report with earlier reports.  Here is what I found:
From 2009 through 2013:

and from 2009 through 2012:

In case it isn't obvious from the graphs, according to the NELP, wage declines have increased across every single wage quintile from 2012 to 2013, and even more in from 2013 to 2014! Even with the NELP saying that hiring in high wage jobs took off in 2013 into 2014.
To double-check the NELP data, I went to the OES database, which can be found here: (http://www.bls.gov/oes/tables.htm) and obtained the median hourly pay for all occupations for each year 2009-14, and then divided by the change in prices as calculated by the CPI from May 2009 (the OES is calculated as of May of each year), and here is what I got (pay in column 1, CPI change from 5/09 in column 2, "real" pay in column 3, and the YoY change in "real" pay column 4):
2009 $15.95
2010 $16.27 2.1 $15.94 -0.1
2011 $16.57 5.2 $15.75 -1.3 -1.2
2012 $16.71 7.6 $15.53 -2.6 -1.3
2013 $16.87 8.8 $15.51 -2.8 -0.2
2014 $17.09 10.9 $15.41 -3.6 -0.8
The NELP shows real median wages down -4.0%, not -.3.6%, since 2009, so they appear to be using a different inflation adjustment.
But more importantly, the OES data shows not just a continuous decline from 2009, but the decline in real wages actually *accelerating* from 2013 to 2014 -- much moreso than during the much weaker labor market of 2009-10!
I'm at a loss for an explanation.  This data cannot be dismissed as at outlier because it is very thorough.  But still it is not at all in accord with what other data on real wages have been showing. 
Is it possible that there has been a dynamic process where ever more employers are learning that they can freeze employee wages and get away with it?  This is a real puzzle.

Wednesday, September 2, 2015

Forecasting the 2016 election economy: using housing permits toforecast the unemployment rate

D  - by New Deal democrat

One of the best economic indicators for the electoral success (or not) of the incumbent party in Presidential elections has been whether the unemployment rate during the 2nd and 3rd quarters of the election year is declining or not.

Among economic indicators, the unemployment rate is unusual.  In and after recessions, it is a lagging indicator.  At economic peaks, however, it is a leading indicator.  In other words, it is overly sensitive to the downside, turning negative before a recession, but remaining negative after the recession is over.

One good way to anticipate the unemployment rate is to look at long leading indicators.  Specifically in this post I am going to examine the relationship between building permits and the unemployment rate.  The interactive graph of housing permits and the unemployment rate can be found here .

To give you the easy overall picture, let's put up the graphs.  First, here are housing permits (blue, left scale) and the unemployment rate (red, inverted, right scale):


The median number of months by which the unemployment rate lags housing peaks is 12 months, and for troughs is 10 months.

That tells us that the unemployment rate should continue to trend lower through at least about next May.

The next two graphs are the YoY% change in permits (blue) vs. the YoY% change in the unemployment rate (red, inverted), for 1964-84, and then for 1985-2015:


That permits lead the unemployment rate is obvious .

Further, we can say with certainty as to the last 50 years that when housing permits have advanced by more than 10% YoY, the unemployment rate YoY has never turned negative.  Similarly, with one exception (December 1987 and January 1988), whenever permits have been negative by more than 20%, the unemployment rate has always turned negative.

Unfortunately, from December 2013 through April 2015, permits while positive were up by less than 10% YoY. Here the record is more mixed.  In the last 50 years, there have been similar slowdowns 8 times.  On 4 of those occasions, the unemployment rate never turned negative YoY. On the other 4, unemployments did turn negative.  Conversely, in the last 50 years, there have been 6 times that permits turned negative, but less so than 20%.  Of those occasions, the unemployment rate also turned negative YoY twice.  In the remaining 4 times, the unemployment rate YoY remained positive.

Turning back to the 4 occasions where a slowdown in the growth in housing permits led to a YoY increase in the unemployment rate, the lead times were 8, 13, 13, and 14 months on the way down and -1, 2, 6, and 14 months, respectively.

In other words, if the slowdown in permits that began in December 13 were to have led to a YoY increase in the unemployment rate, based on the admittedly limited sample we would expect that downturn to have already started, and a coin flip as to whether it would already be over.

Even where there has been a downturn in permits without a recession, the negative turn in the unemployment rate began between 2 and 11 months later, and ended from 1 to 12 months later.

Finally, the trough in the unemployment rate has followed the trough in permits (including both slowdowns and downturns) by a median of 5 months.  Since the YoY trough in permits occurred in April 2015, this means the YoY trough in the unemployment rate should occur this month (September) and almost certainly no later than April 2015.

Finally, here is a slightly different look: the YoY change in permits (blue, in 100,000s) vs. the YoY change in the unemployment rate (inverted, red):


Here is a close-up of the last 5 years:


While the same general leadling/lagging relationship is apparent, this measure highlights how unusual 2014 was.  Permits increased YoY generally all year, but only slightly, i.e., by less than 100,000.  In the last 50 years there have been only 2 similar periods, 1962, 1968 (somewhat), and 1986 (shown in the graphs below).


Typically, permits have merely "passed through" the range of 0 to +100,000 YoY on the way to a stronger expansion on the way up, or a recession on the way down, so the extended pause was anomalous.  

In 1963, the unemployment rate actually rose slightly (by less than 0.5%) in response to the poor housing market the year before. The lag between the beginning of the pause in permits and the rise in the unemployment rate was 9 months. The trough in permit growth was also 9 months after the onset.  The worst YoY unemployment rate comparison happened both 9 and 11 months after the onset of weakness in permits.  The lag at end of the pause was 16 months.  This is the "worst case" scenario for the incumbent party. If this were to happen now, it would suggest the worst YoY comparisons for the unemployment rate in the 2nd quarter of 2016, 

In 1987 and 1988, the unemployment rate gradually tailed off YoY from a decline of -1.0% to -0.5%.  Permits in 1968 were very gradually decelerating until they outright declined in 1969.   The unemployment rate in 1969 gradually rose into the 1970 recession.

The bottom line is:

1. We are currently in a softening of the YoY% change in the unemployment rate, that began in December 2014, forecast by the slowdown in building permits
2. Based on past incidents, we should be near the maximum point of that slowdown.
3. The softening in the YoY decline in the unemployment rate should pass by the 2nd quarter of 2016.
4. In the worst case scenario for the incumbent party, based on 1962-63, the unemployment rate might rise slightly over the next few months before resuming its decline by the end of this winter.
5. The most likely scenario is that, with some monthly variation, the unemployment rate should continue to decline through at least through next March, and probably through next May.  Beyond that is presently unknown.

This is good news albeit preliminarily for the democratic Presidential candidate.

Monday, August 31, 2015

Comparing labor market recoveries


 - New Deal democrat

With few exceptions, people don't get a job for social reasons.  They go to work each day in order to earn money to purchase necessities, discretionary goods, and to save for future needs.  In short, they work because of cold, hard cash.

So why is it that most economic writers appear to think the defining element of a labor market recovery after a recession is the number of jobs created? Isn't the better measure the amount of cold, hard cash it is delivering to workers?  That, dear reader, is measured by real aggregate wages, and that, I believe, is the best measure of labor market recoveries.

Let me give you a few examples.

First, compare an economy that creates 1 million 40 hour a week jobs at $10/hour, with an economy that creates 2 million jobs at 10 hours a week at $10/hour.  If we were to count by job creation, the second economy would be better.  But that's clearly  not the case.  The second economy is paying out only half of the cold hard cash to workers as the first.

Next, let's compare two economies that both create 1 million 40 hour a week jobs, but one pays $10/hour and the other pays $12/hour.  Clearly the second economy is better.  It is paying workers 20% more than the first.

Finally, let's compare two economies that create 1 million 40 hour a week jobs at $10/hour.  In the first economy, there are 3% annual raises, but inflation is rising 4%.  In the second, there are 2% annual raises, but inflation is rising 1%.  Again, even though the second economy is giving less raises, it is the better one -- those workers are seeing their lot improve in real, inflation-adjusted terms, whereas the workers in the first economy are actually losing ground.

In each case, the economy creating more jobs, or more hourly employment, is inferior to the economy  that pays more in real wages to its workers,  In other words, the best measure of a labor market recovery is that economy which doles out the biggest increase in real aggregate wages.

So let's compare the increase in real aggregate wages -- the total wages paid to all nonsupervisory workers, adjusted for inflation, from their bottom in each recession.  Since that was 5 years and 9 months ago for our current recovery, that will be our measuring stick.  This is calculated as follows: average hourly earnings for nonsupervisory workers, times average hours worked, times the number of jobs, and then divided by the consumer price index, with the result indexed to 100 at the bottom.  Here are the results:

Trough Peak #months Real wage
growth %
 Wage growth
per month %
Wage growth
at 69 months
1/64*  8/6967* 30.2 .45  30.0%
11/705/7430   18.5 .62 11.8%***
4/753/79 47 20.8 .4411.5%*** 
7/801/81 62.4 .40  9.3%***
11/8210/8983 21.6  .26  18.4% 
2/9211/00  10533.8 .32  21.7%
4/03 9/07 53 10.5 .208.0% 
10/097/15**   69** 16.3 .2416.3%

*start of series

**to date

***Measured through the next recession, as recovery was short-lived

The interactive FRED graph of real aggregate wages can be found here.

An interesting aside is that the "Reagan recovery" of the 1980s is either great or mediocre depending on where you measure.  In the first 14 months, real aggregate wages grew 7.9%, or a blistering .56%  a month! In the last 69  months, however,  they grew only 9.3%, or a miserable .13% a month.  Had I measured back from the end rather than forward from the beginning, the current labor market recovery would be stronger.

 We can immediately see the effect of labor bargaining power, as all of the economic expansions before the 1980s showed far faster real aggregate wage growth per month than any expansion since.   On a per-month basis, the current labor market recovery is only better than the George W. Bush recovery.  Over the total recovery, the current recovery is only better than the George W. Bush recovery, and the 6 month recovery at the end of Jimmy Carter's term.

But because it is longer lasting, however,  after 69 months the current labor market recovery  has a better record than the short-lived recoveries of the 1970s and the brief 1981 recovery as well.   By this  measure it only  lags the 1990s recovery as well as the 1960s, and, depending on whether you measure forward from the beginning  or back from the end of the 1980s recovery, the current recovery is slightly worse, or significantly better than that labor market recovery.  Should the current recovery last another 24 months, it will probably surpass the Reagan recovery by either measure.

The bottom line is that the record  of this labor market recovery is mixed: poor monthly growth due to nonexistent labor bargaining power; but good total growth based on its persistence.  

Friday, August 28, 2015

Corporate profits in Q2 set another record


 - by New Deal democrat

Since corporate profits are a long leading indicator for the economy, and stock prices a short leading indicator, that means ... I have an important post up at XE.com .

BTW, sorry about the light posting here this week.  I have been working on a bunch of things, but partly due to real life, and partly due to this week's exciting action at the dog track, it made sense to post more topical financial markets stuff over at XE.

Wednesday, August 26, 2015

A simple point about the Chinese stock market crash


 - by New Deal democrat

As I wrote yesterday, the only thing that has been added to the economic news this summer, that we didn't already have last fall, is the Chinese stock market crash.  And wherever that crash is going to bottom out, it is most of the way there.

Here is a graph of the Shanghai index for the last 25 years:


Notice that the recent market bubble and burst aren't as severe as the 2008 crash, in which the Shanghai composite lost about 70% of its value from peak to trough.  And then bounced back smartly.

Here's a close-up of 2015:


The Shanghai composite is already down 45%. Most of the damage has been done.

No inside information, but the big selloffs in the late afternoons the last two days have to odor of forced liquidation.  We saw a similar pattern in October 2008 after the September crash.  The forced liquidation reached a climax, and that was the bottom.

By the way, here is what American corporate insiders have been doing:


They've been buying, and that was before the big downturn in the last week.

My focus in this blog is on the economy, not on investing. And my focus on the economy is mainly about jobs and wages.  While I have a sneaking suspicion that one or more hedge funds will be carried out on their shield in the very near future, I just don't see this as having a big impact on the US economy at large, although job and wage *growth* will probably stall or decelerate.

Bottom line: whatever collateral damage a Chinese stock market crash might do to the US economy is almost certainly already priced in at this point.

Tuesday, August 25, 2015

China sneezes, and the US catches ... the sniffles


 - by Neew Deal democrat

I have a new post up at XE.com, entitled "The China Syndrome."

Saturday, August 22, 2015

Weekly Indicators for August 17 - 21 at XE.com


 - by New Deal democrat

My Weekly Indicator post is up at XE.com.

The US$ is "King of the World" at the moment. The resulting weakness in markets has brought mortgage rates back into positive territory for US consumers.

Friday, August 21, 2015

WE'RE DOOOOMED!!!! S&P goes negative YoY


 - by New Deal democrat

I have a special comment up at XE.com.

Given what has been happening with corporate profits, and the likely impact of China's currency devaluation, this really shouldn't be a surprise.

The good news is, if the Fed is wrong, it can reverse course. The bad news is...


 - by New Deal democrat

To find out, click on over to my new post up at XE.com.

See, I can write a clickbait headline just like Business Insider!

Thursday, August 20, 2015

The implications of the child care cost crush for median household income and "shadow unemployment"


 - by New Deal democrat

The other day I showed that there is compelling evidence that the primary reason for the long term decline in the Labor Force Participation Rate in the 25 - 54 age range is the increasing real cost of child care, coupled with stagnant to declining real wages in the lower paying jobs typically taken by the second earner in a two earner household.

Today I have a few more precise graphs, and discuss the implications for median household income and the issue of "shadow unemployment" or "missing workers."

First of all is a graph of the increase in the number of those aged 25-54 who are neither employed nor unemployed, but out of the labor force entirely:


Unfortunately this is not avaiable on FRED, but via the BLS, here are the number of people in that above group who tell the Census Bureau each month that they want a job now:

thie number of people aged 25-54 who told the Census Bureau that they were out of the labor force, but wanted a job now, peaked in 2011.

Subtracting the second number (second column below) from the first (first column below)  gives us the number of people aged 25-54 who tell the Census Bureau they *don't* want a job now (third column below):

1999: 17.5m   2.0m   15.5m
2011:  20.9m   3.0m   17.9m
2015:  22.4m   2.5m   19.5m

What I showed the other day is that the big reason for the increase in this last number is the cost of child care vs. wages, which over the long term has become increasingly onerous.  Another piece of supporting evidence comes from the below chart in the 2014 Pew Research Center's report on women in the job market:


The Pew study found that as of 2012 the vast majority --  85% -- of stay at home married mothers say the reason for not working is to take care of their children.  Note also that the number of women staying at home is much larger for age groups 25-54 than for those either young or older.  The only thing not making this the ultimate "smoking gun" supporting the child care cost crunch thesis is that the study makes no comparison with 1999.

Implications for real median household income

Like the LFPR, real median household income has declined across most age cohorts since 2000.  Here is a graph I have run a number of times, showing real median household income for various age groups (h/t Doug Short):


Aside from the unemployment rate, working age people dropping out of the labor force due to increasing child care costs is the most important reason for the failure of median household income to return to its level in 2000.  After all, giving up a second income necessarily means that the household's income is less than otherwise.

Implications for "shadow unemployment"

Finally, here is a graph of what the Economic Policy Institute calls "missing workers:"


The EPI defines "missing workers" as
potential workers who, because of weak job opportunities, are neither employed nor actively seeking a job. In other words, these are people who would be either working or looking  for work if job opportunities were significantly stronger. Because jobless workers are only counted as unemployed if they are actively seeking work, these “missing workers” are not reflected in the unemployment rate.
Note that this has been rising since 2007, unlike virtually all other metrics.

I have been critical of this measure, which is based on projections from a 2006 Regional Fed study. The Census Bureau's series "Not in Labor Force, Want a Job Now" measures exactly what the EPI claims to be calculating, and that peaked out about 4 years ago. To the point, parents who stay at home to raise their children and tell the Census Bureau month after month that they  quite simply don't want a job now are not "missing" from the unemployment rate.

But since increased wages, especially for lower quintile jobs, change the equation for families considering whether to have the second spouse work, i.e., increased real wages should result in more spouses opting to work, the Center's "missing workers" statistic, including its continued slow rise, makes perfect sense if we describe it not as those who have dropped out of the work force, but would return if the job market was strong, but rather as those who would return to work if wages were better.

The effects of the child care cost crush not only unravel the mystery of the decline in the prime working age Labor Force Participation Rate, but it is also the missing piece in the puzzle of the similar secular decline in real median household income, and the rise in "missing workers." Once we include these effects, almost all of the mysteries in current labor market statistics disappear.

Wednesday, August 19, 2015

July consumer prices: all intact trends continue


 - by New Deal democrat

This morning's CPI report for July was a big yawn, coming in at +0.1% just as expected, and YoY CPI also unchanged at +0.2%.  OMG, the Fed simply *must* raise rates as a precaution!!! < / snark >

So let's look at a couple of useful bits of information.

First, inflation continues to be confined almost exclusively to housing.  The below graph comparing CPI for shelter (blue) vs. everything else (red) continues to show housing inflation a little on the "hot" side, while everything else remains in the most severe deflation in the last 50 years outside of the Great Recession:


Next, we can now show real retail sales for July, which continue to show an improving trend, although they did not make a new high:


Finally, over the longer term YoY real retail sales tend to lead YoY employment.  The recent deceleration in growth of real retail sales is another reason to suspect that YoY job growth will fade at least a little bit, with reports under 225,000 or maybe even under 200,000 a month:


Basically, all of the existing trends are still intact.

Tuesday, August 18, 2015

July housing permits and starts: no cause for celebration or concern


 - by New Deal democrat

I have a new post up at XE.com analyzing this morning's housing permits and starts report.  We are neither Delivered nor Doomed.

Do rising child care costs & stagnant wages explain the declin e in the Labor Force Participation Rate ?


 - by New Deal democrat

What is driving the long term decline, shown in the graph below, in the labor force participation rate (LFPR) among prime working age adults, ages 25-54?  


A couple of weeks ago I wrote that it wasn't poor job prospects.  In that post I ran the following comparison.  First, I calculated the number of persons in age group both unemployed and also not in the labor force for age group 25-54.  That is the (red line in the graph below).  Then I calculated what the  number would be if we added together the unemployed in that age group, plus a proportionate share of  those Not in the  Labor Force, but Who Want a Job Now (blue):


If the primary explanation for the decrease in the employment-population ratio for ages 25-54 were the inability to find a job, the result of the two calculations should be the same.  In fact, the second calculation (in blue)  gives me a much lower value.   That tells us that the primary driver of the increase in persons not being employed in age group 25-54 is not poor job prospects. 

There is compelling evidence that  the main culprit is increased child care costs, paired with stagnant or declining real wages.
    
Let's start with a framework for the discussion.  Many families face a familiar choice between hiring a contractor vs. doing it yourself for a variety of tasks.  For example, do I mow my lawn myself, or do I let a landscaper do it? All else being equal, higher costs for hiring a contractor will cause some increase in the number of homeowners who decide to do the task themselves.  The same process would apply to other tasks, like hiring a painter or someone to install a new automatic garage door.

But since all of the above tasks can be done on nights or weekends, a choice to perform them doesn't mean the homeowner doesn't have to give up time from work to go the DIY route.

Child care stands alone.   A choice not to send children to day care inevitably means limiting at least one spouse to part-time work, or dropping out of the labor force entirely.  In other words, the cost of day care must be weighed against the income earned from a job.  This is a balance: the higher the cost of daycare, or the lower income earned from a job, the more we should expect a parent to choose part-time work or dropping out of the labor force entirely.

So, what has been happening to the costs of child care?  And what has been happening with real wages, especially in the lowest two quintiles of paying jobs, which a second income earner in a household is likely to be in (the primary earner by definition holding a higher paying job)?  There is strong circumstantial evidence that both the real cost of day care has risen, and real pay in the lowest two quintiles has been particularly hard hit.  In other words, the data supports a hypothesis that the secular decline in the LFPR among working age families has largely being driven by the issue of child care. 

To begin with, the real, inflation adjusted cost of child care has been soaring for 30 years with nary a break:


The Bloomberg article last week which featured that graph explained:
 There’s been a growing push for childcare workers to be better trained and educated, and the costs associated with those efforts make it tougher for managers to scrape up pay increases for existing personnel, said Anna Carter, president of the Chapel Hill, North Carolina-based Child Care Services Association.The mismatch in supply and demand has made childcare a “broken market,” said Marcy Whitebook, director and founder of the Center for the Study of Child Care Employment at the University of California at Berkeley.
"Mothers who do work are paying more than ever for child care. In  inflation-adjusted dollars, average weekly child care expenses for families with working mothers who paid for child care (24% of all such families) rose more than 70% from 1985 ($87) to 2011 ($148), according to research  by the Census Bureau. For those families, child-care expenses represent 7.2% of family income, compared to 6.3% in 1986 (the earliest year available).
 Meanwhile, in particular since the Great Recession, median pay for the lowest quintile of jobs declined more than any other category, into 2014, the latest data I could find, from the National Employment Law Project:


Last year, the average cost of child day care in the US was $11,666, according to  Babycenter.com.    Meanwhile, an earner at the top of the 5th quintile, working a full time job, is making about $19,000 a year; a worker at the top of the 4th quintile, about $25,000. 

That means a household with a second earner whose job pays among the lowest 20%, and well into the lowest 40%, might actually have a net financial gain by foregoing the second income to dispense with day care costs, and get the benefit of having a parent at home full time to run the household and be with the kids when they aren't in school.

While I have been unable to locate any data specifically quantifying the average or median incomes of primary vs. secondary earners in a two income hosusehold, a 2009  study by the BLS found that the median part time secondary earner makes 62.8% of part time primary earner  But if anything, that percentage is too high, since most two income households are probably either both full time workers, or a full time worker and a part time worker.

More to the point is a December 2013 paper by the Hamilton Project, which found that the median 1 earner family income was ~$40,000, while the median 2 earner family income was ~$60,000.  


By implication, the median part time earner only makes about 1/2 of primary earner, $20,000 vs. $40,000.  Even that disparity is probably underestimating the true number, since the primary earner by definition is earning more, and is probably earning more than the median of all workers. 

Remember that we are dealing with the *change* in the cost-benefit analysis that families make.  As a simple matter of supply and demand, that day care costs have far outrun inflation, and that real wages among the lower two quintiles of jobs have declined, and declilned by more than the upper quintiles, implies that more parents would make the choice to stay at home.

This hypothesis gains some support by correlating well with the fact that LFPR for those aged 55-54 did not decline during 2000 - 2007, but rose:


By this time, the kids are in college if not already out of the house.
An even more compelling correlation is  the fact that the decline in the LFPR for men (-4%) has outpaced the decline in the LFPR for women(-3%): 
   

Thirty years ago, men who might otherwise have wanted to stay at home to raise their kids faced intense societal pressure to work anyway.  Now, not so much.  According to the Washington Post last year:
 The number of stay-at-home Dads has doubled in the last 25 years, reaching a peak of 2.2 million in 2010, according to a new report by the Pew  Research Center. ....

The new Pew Research Center report found that in 1989, only 5 percent of the 1.1 million at-home fathers said they were home to be primary caregivers. That share has increased four-fold now to 21 percent, a sign not only of the power of economics in reshaping traditional family structures, but of shifting gender norms.
  
"The assumption that a lot of people make is that the number of stay-at-home dads went up because of the recession. And while that’s absolutely true, even if you take out that trend altogether, the fact is the number has been going up over time, regardless. And the biggest increase is in the share of fathers who want to stay home to take care of kids," said Gretchen Livingston, author of the new report. "That’s very striking." 

The Pew Research study findings are nearly a "smoking gun" in support of the thesis  that that  the increase in stay at home parents are the force driving the decrease in the prime working age LFPR.

Without quoting the Pew study at length, the numbers are very instructive.  Over the same time period, the total number of stay at home parents for all reasons increased by 1.5 million, with 700,000 of the increase being women.  Between 1989 and 2012, the total number of stay at home dads, for all reasons, grew by 808,000.  Of that 808,000,
  • 364,000 stayed at home to raise the kids
  • 295,000 due to inability to find work
  • 165,000 to go to school, being retired, or other reasons
  • 84,000 due to disability
In other words, even shortly after the end of the recession, 45% of the entire increase in stay at home dads since 1989 was in order to raise the children.  While by no means a perfect fit, that is still pretty close to a "smoking gun."

Update:  The BLS tables show that between 2001 - 2014, the number of people age 25 - 54 who are not in the labor force and did not want a job increased 3.3 million from 17.8 million to 21.1 million. No graphs, but the raw data can be found here.  While not directly comparable, Pew showed an increase of this number by 2.6 million from 1989 through 2012, the lion's share of which occurred after 2000.  That means the only missing piece of the puzzle is how much of the increase in women staying at home, about 600,000 from 1989-2012 as derived from the Pew data, is for child care reasons.

Update 2: I have now found an equivalent study by the Pew Research Center about stay at home moms.  The study states:
 
The share of mothers who do not work outside the home rose to 29% in 2012, up from a modern-era low of 23% in 1999, ... A growing share of stay-at-home mothers (6% in 2012, compared with 1% in 2000) say they are home with their children because they cannot find a job.

A little math shows that the number of stay at home moms for reasons *other* than inability to find a job has risen by 4.5% from 22.8% in 1999 to 27.3% in 2012.  The Pew study on women does not break down this remaining number by those staying home due to disability, retirement, education, or other reasons besides raising children.  
Of course this is not conclusive, and correlation is not necessarily causation.  In particular, I have no information as to how the real  median wage of second earners has changed over time.

To conclude, in short:
  1. the decision to be a stay at home jparent in a two earner family should rise when child care costs rise and/or lower quintile wages fall.
  2. child care costs have been rising inexorably for several decades
  3. wages for lower quintile jobs have been particularly hard hit since the Great Recession
  4. data from a study by the Pew Center show that 45% of the increase in the number of stay at home dads is in order to raise children
  5. although we do not have the equuivalent data for women, the cirucmstantial evidence is compelling that the i ncreased real costs of child care vs. wages are the primary explanation for the secular decline in the LFPR among working age families over the last 15 years.

Monday, August 17, 2015

Weekly Review Columns

I'm back from vacation.  Here are last week's reviews and this week's previews, all over at XE.com

http://community.xe.com/blog/xe-market-analysis/international-preview-aug-16-21

http://community.xe.com/blog/xe-market-analysis/us-equity-and-economic-review-august-10-14

http://community.xe.com/blog/xe-market-analysis/international-economic-week-review-aug-10-14

The labor market isn't tight, just employers' wallets


 - by New Deal democrat


Via Mark Thoma, Prof. Stephen Williamson writes a nice, thorough post on the state of the labor market, which is well worth reading in full.

One point on which I disagree with his analysis has to do with the Beveridge curve, i.e., the tradeoff between the unemployment rate and job openings, which he graphs here:


He writes, 
Early in the post-recession period, people were speculating as to whether the rightward shift in the Beveridge curve was due to cyclical factors (the Beveridge curve always shifts rightward in a recession) or some phenomenon related to mismatch in the labor market (the unemployed don't have skills that match well with the posted vacancies). Perhaps surprisingly, the Beveridge curve has not shifted back, with the end of the Great Recession now more than 6 years in the rearview mirror. That would seem to put the kabosh on cyclical explanations for the phenomenon. But it's not clear that mismatch fares any better in explaining the Beveridge curve shift. If that's the explanation, why doesn't the mismatch between the searchers and the searched-for go away?"
And he concludes his review in part thusly:
Employment growth is currently strong, and by most measures the labor market is currently somewhat tight to very tight. 
In other words, the labor market is tight because even with a U3 unemployment rate of 5.3%, job openings are soaring. Although he doesn't mention it, there are more job openings now than even during the height of the tech bubble at the beginning of 2000!

I disagree.  And the reason can be found with wages.  Below is a graph of job openings, minus new hires (i.e., the number of unfilled job openings) (blue) vs. YoY nominal wage growth (red):


By and large, the two series moved in tandem since the JOLTS series began in 2000, through 2010.  Since then, there have been three distinctive episodes:

1. During 2011-12, wage growth declined. Unfilled vacancies rose.
2. In 2013-early 2014, wage growth improved. Unfilled job opensings plateuaed.
3. Since mid-2014, wage growth has flagged.  Unfilled job openings have soraed   

 Note that at 2%, YoY wage increases are well below even the 2003-07 average of about 3.5%.

This is a market which is not clearing.  Prospective employers and employees are at a standoff. To put it less charitably, employers can't find workers to fill their job openings ... for the paltry wages they want to pay them.  With near record corporate profits, that isn't a tight labor market. It's tight-wads.