- by New Deal democrat
There was a big decline in housing starts last month, and a smaller but significant decline in permits. Whether that signifies a change in trend or just noise is the issue. I lean towards the latter. To wit, in reaction to both January and Feburary’s housing construction report I wrote, “To signify a likely recession, units under construction would have to decline at least -10%, and needless to say, we’re not there. With permits having increased off their bottom, I am not expecting such a 10% decline in construction to materialize.” I also indicated that I expected to see more of a decline in the actual hard-data metric of housing units under construction.
That is still the case.
To recapitulate my overall framework: mortgage rates lead permits, which lead starts, which lead housing units under construction, all of which lead prices. Of those metrics, the least noisy one that conveys the most signal vs. noise is single family permits.
In response to inflation data which generally stopped declining towards the holy 2%, mortgage rates have risen about .25% since the end of last year. For March as a whole, they averaged 6.82%. This is about average for the past 18 months, in which overall they have varied between 6.1% and 7.8%. In response permits have stabilized in the range of 1.42 million to 1.52 million units annualized. In March they declined -65,000 to 1.458 million annualized:
The relationship shows up even better when we compare the two series YoY:
With mortgage rates higher by a slight 0.25% YoY, permits went slightly positive YoY and are still higher by 1.5%.
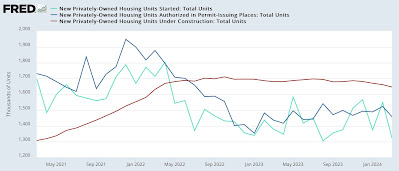
As per usual, starts (light blue in the graph below) are the noisier of the metrics, declining 228,000 to 1.321 million annualized in March. Permits (dark blue) declined -65,000 to 1.458 million, and single family permits (red, right scale) declined -59,000 to 973,000:
These are among the poorest numbers for each in the past 12 months, but the simultaneity of the downturn (as opposed to a 1-2 month lag in starts) makes me suspect there may be a seasonal adjustment issue in play, perhaps having to do with Easter. Still, there isn’t enough there to break out of their range, and as discussed above mortgage rates have not suggested one is coming.
Next, to reiterate: housing units under construction (red in the graph below) are the best measure of the actual economic activity in the housing market. Here’s the long term historical view:
Those also declined, by -15,000, to 1.646 million units annualized:
Once again note the synchronicity of the downturn, making me suspect a seasonality glitch. Further, they are only down -3.7% from their peak, nowhere near the historical -10% most consistent with the onset of a recession.
Below I have broken out single vs. multi-family construction. Because, in response to record high house prices, builders turned to higher density, lower cost apartment and condo construction. Hence the record high last year in that metric. Last month multi-family construction faded slightly, while single family units under construction actually continued their slightly increasing trend:
As I wrote last month, I do expect a further gradual decline in total housing units under construction in the months ahead, to catch up with the decline in permits that bottomed one year ago. Here’s the post-pandemic view of starts, permits, and total units under construction:


