- by New Deal democrat
Existing home sales are the least noteworthy of the housing data, because of the very limited economic activity moving into or out of an existing home provokes compared with the construction, furnishing, and landscaping of a new home. But it’s worth a brief look, so let’s note this month’s report.
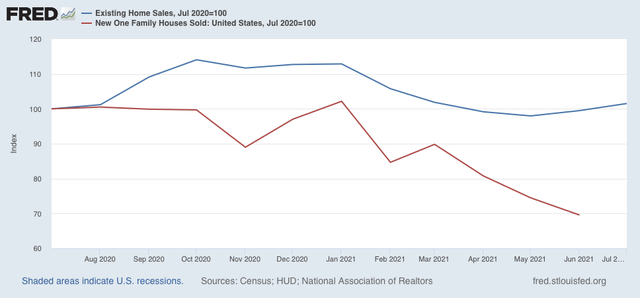
Existing home sales (blue in the graph below) are only up 1.7% compared with one year ago, as opposed to new single family home sales (red), which are off over 30%! :


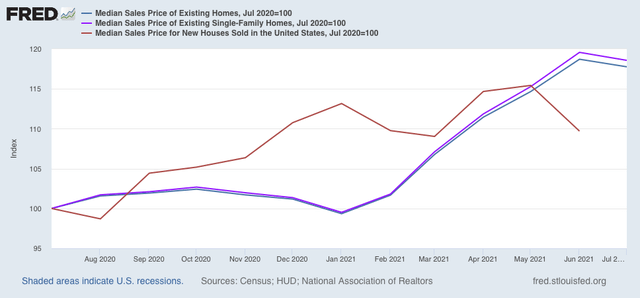
Prices for all existing homes (blue) and single family existing homes (violet) are up almost 20% - which is still less than the 23% YoY increase recorded one month ago. Note that the median price for new single family homes (red) is also higher, but much less so at 10%:

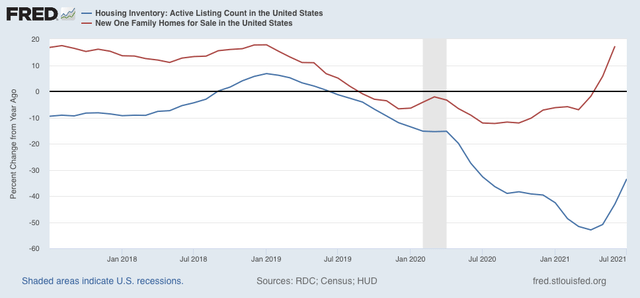
It is likely that the supply constraint of lumber for new homes has crimped some construction, driving some demand to existing homes, the median price of which tends to be less, and which in turn is driving up the prices for same, as well as driving down inventory. Here’s a look at the YoY% change in inventory of existing homes (blue) vs. new homes (red) for the past 4 years:

In general both move in tandem (and in the case of new homes, we know that inventory lags both sales and prices), but the decline in existing home inventory, which had been slow for the past decade, started to accelerate even before the pandemic hit as sales increased.
As more and more potential buyers grow gun-shy about the insane price increases, I expect prices to level off and then actually decline, with a concomitant increase in inventory that likely began in the spring.