- by New Deal democrat
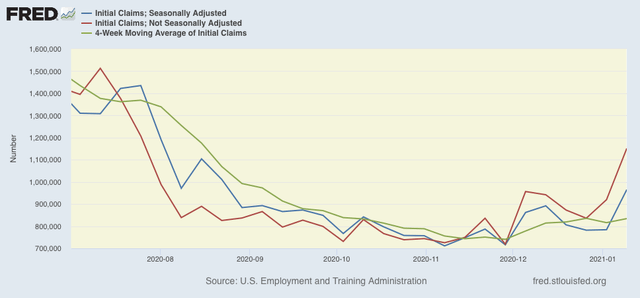
On a unadjusted basis, new jobless claims rose by 231,335 to 1,151,015. Seasonally adjusted claims also rose by 181,000 to 965,000. The 4 week moving average rose by 18,250 to 834,250.
Here is the close up since the end of July (these numbers were in the range of 5 to 7 million at their worst in early April):

There is now a 2+ month trend of YoY% increases in initial claims. Further, by rising to over 900,000, seasonally adjusted claims hit one of my two markers for a fundamental change of trend. But the 4 week average, which is still under 850,000, did not.
For the last couple of months, I have been cautioning that the holiday season plays havoc with seasonality even in normal years, let alone a year when the pandemic is causing changes in weekly numbers by an order of magnitude. That was especially so this week. Typically in the weeks after Christmas and New Years’, claims go up by 25,000 to 50,000 on an unadjusted basis. This year claims went up by up to 10x as much.
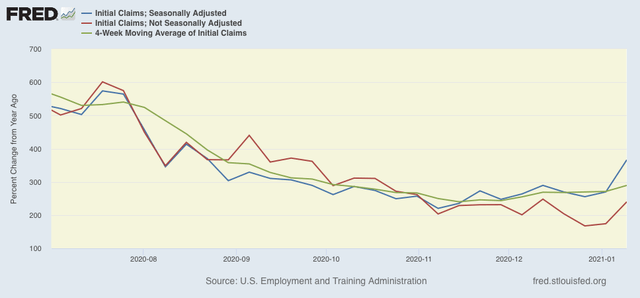
But when we look at the YoY% change in all of the above metrics, which washes out those outsized seasonal affects, the picture is not nearly so negative:

While weekly seasonally adjusted claims have risen 366% - a YoY comparison last seen in August, non-seasonally adjusted weekly claims, and the 4 week average are still in the YoY range they were in October, at +240% and +290% respectively. In fact the non-seasonal trend looks more sideways than increasing.
In other words, this was one bad week of data, but we are clearly above November lows, but nothing awful (or at least, not materially *more* awful than before) has happened yet.
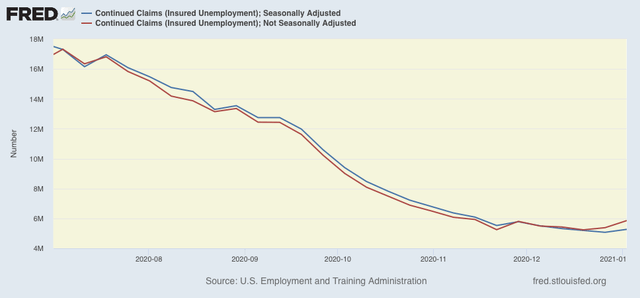
Turning to seasonally and non-seasonally adjusted continuing claims, which historically lag initial claims typically by a few weeks to several months, the former rose by 199,000 to 5,271,000, and the latter rose by 474,180 to 5,856,230:

Finally, as I usually note, a reminder that both initial and continued claims remain at or above their worst levels from the Great Recession.