- by New Deal democrat
Weekly initial and continuing jobless claims have been giving the most up-to-date snapshot of the continuing economic impacts of the coronavirus on employment. This week continues the trend of slightly improvement (or, more truly, slightly less awful).
Below are initial jobless claims both seasonally adjusted (blue) and non- seasonally adjusted (red). The non-seasonally adjusted number is of added importance since seasonal adjustments should not have more than a trivial effect on the huge real numbers:
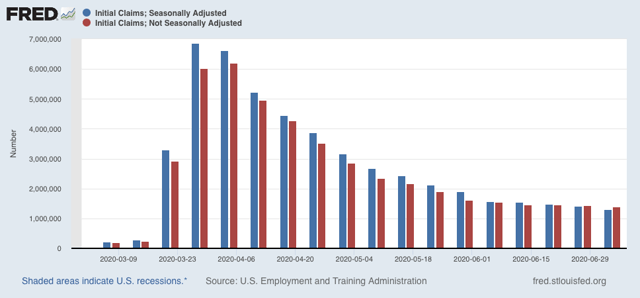
There were 1.400 million new claims, 31,000 less than one week ago. After seasonal adjustment this became 1.314 million, 99,000 less than last week’s number. The good news is, this is the smallest weekly decline since the worst reading in April. The bad news is, it is only 250,000 (or 17%) less than five weeks ago. In other words, the improvement is slight and huge second-order impacts in terms of new layoffs continue to spread.
There has been some slight improvement in the trend of continuing claims, which lag by one week, and which after revisions have declined about 15% since late May. This week on a non-seasonally adjusted continuing claims declined by 629,500 to 16.797 million, almost 6 million below their peak of 22.794 million seven weeks ago. After seasonal adjustment they declined 698,000 to 18.062 million, 6.850 million below their peak of 24.912 million seven weeks ago:
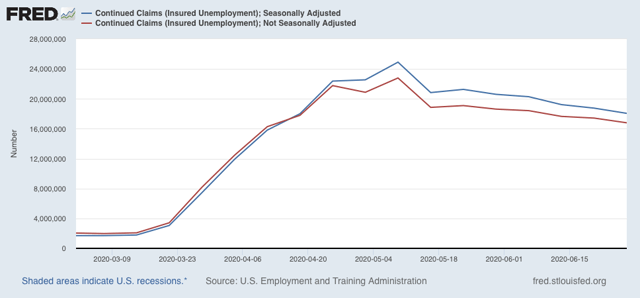
In essence, so far the callbacks to work from various sectors “reopening” have outweighed the new layoffs weekly. For the last few weeks, this had looked like it was stalling, but with revisions and this week’s numbers we have continued progress in being “less awful.”
Now let’s turn to the other employment-focused release from earlier this week, the JOLTS report, which shows both the hiring and discharges sides of the jobs ledger. Note that this lags by one month, so was for May, which the first month of job gains after the pandemic started, it will better show us how much rehiring has been occurring.
During the expansion, I was focused on the leading vs. lagging parts of this report. With the pandemic, this is out the window. What I am interested in is decomposing hiring vs. firing. In that regard, the below bar graph decomposes this year’s numbers into hires (blue), fires (red) and voluntary quits (green):
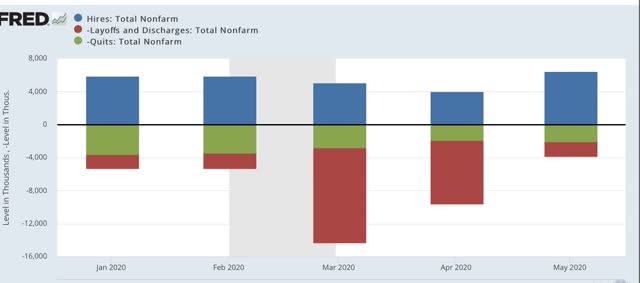
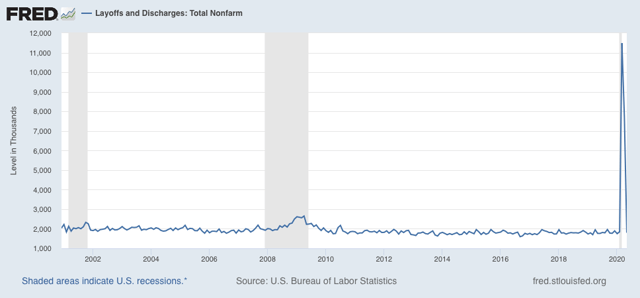
While there have been changes in both hires and quits, both of which declined by roughly 1/3 to 1/2 in the two months of greatest impact, the vast majority of the changes has been in the number of people laid off. As shown in the graph below, these nearly sextupled in March, but by May had returned all the way to their baseline:
Interestingly, the number of hires in May was the highest ever recorded in the JOLTS series. This obviously was due to the surge in “rehiring” to reopen. Below I show both the seasonally adjusted (blue) and non-seasonally adjusted (red) numbers:
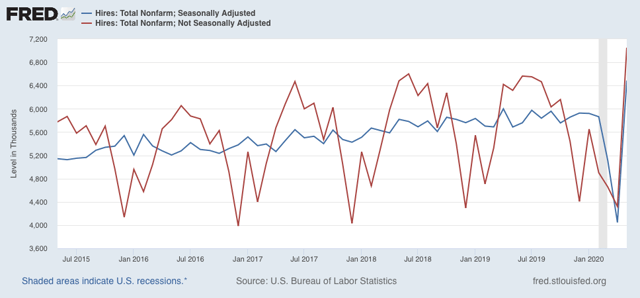
There was a much larger number of new hires in May than ordinarily would be the case, and so this distorted somewhat the seasonally-adjusted number.
In summary, four full months after the initial shock, the overall damage remains huge, with large continuing new secondary impacts. Since the beginning of May, this has been outweighed by the callbacks to the “reopening” economy. Initial claims indicate that continued through last week.
I am expecting this to reverse, as States that recklessly reopened pay the price with surging infections and hospitalizations. This appears finally to be feeding through into increased deaths. All of which is likely to lead to “re-closing” either by edict, or simply by non-viability with customers simply too afraid to patronize businesses. But it hasn’t happened yet.