- by New Deal democrat
The BEA finally released its preliminary report on December motor vehicle sales yesterday, and it is yet more confirmation of the trends I’ve been discussing recently: there is a deepening producer recession, but the consumer is alright - although with some signs of wobbling.
Let’s look at heavy truck sales first, which tells us about the producer side of the ledger. These were estimated at .497 million annualized. FRED won’t update their graph until the final numbers are in later this month, so in the meantime I have subtracted .497 from the annualized number so that December would be 0 in the below historical graph:
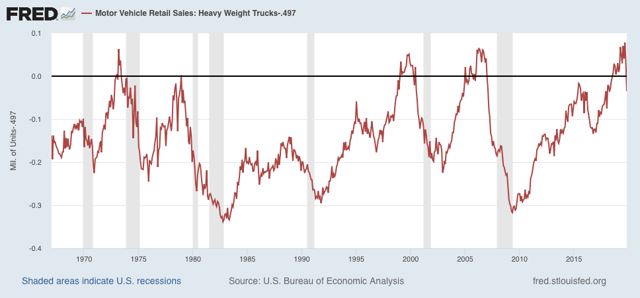
This confirms that November’s steep plunge was not an outlier. The average of the past two months is more than 15% lower than September’s peak of .575 million annualized sales.
More often than not, this scale of decline has meant a recession within the next 6 to 12 months. There are six true positives (1973, 1979, 1981, 1991, 2001, 2007), vs. 5 false positives (1976, 1985, 1996, 2002, and 2016). There is also one false negative (1969). The longer the decline goes on, the truer the signal.
Now let’s turn to light vehicle sales, which tell us about the consumer side of the ledger. These came in at 16.7 million units annualized. As with trucks, I’ve subtracted that number so that December would show at 0 in the below FRED graph:
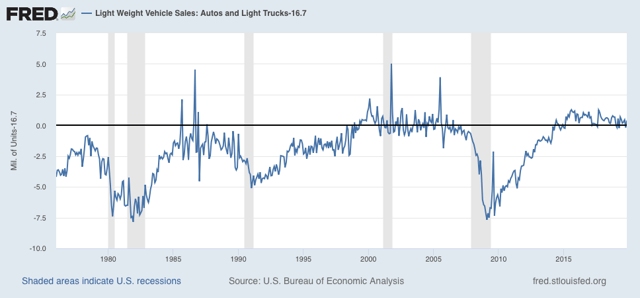
This is about 7% off the recent peak of just below 18.0 million units annualized. In the past, it has typically taken a 10% decline off peak to signal a recession. Also, please note that there is a lot more noise in this metric compared with heavy truck sales.
The takeaway is that we have yet more evidence (on top of the worsening ISM manufacturing numbers) that there is a producer recession, and it is has been deepening. The consumer remains alright, but the trend is weakening there as well.