- by New Deal democrat
This is the latest installment in my series, "Forecasting the 2016 election economy," a real-time experiment to see if I can forecast the outcome of the November 2016 Presidential election by making use of economic indicators up to a year in advance.
We have already seen that a number of economic indicators have a good track record of correlating with the election result, provided we know their values in the first 3 quarters of the election year. We have also seen that at least one long leading indicator, housing permits, has some validity in forecasting the election day status of changes in the unemployment rate, one of the best such economic indicators. We have seen that 80% of the time, just knowing whether or not the economy is in recession in Q3 of the election year has accurately forecast the popular vote winner in the election, going back over 150 years! Finally, we have seen that the long leading indicators through Q3 of 2015 suggest that it is more likely than not that this economic expansion will continue through Q3 of next year, and thus favor the election of the Democratic Party nominee.
There is one other well-known model, from economist Douglas Hibbs, called the "Bread and Peace" model. This model makes use of "real disposable personal income per capita" measured over the entirety of the last Presidential term, with weights for each period prior to the last measurement decreased by 20% (i.e., the last period before the election gets a weighting of 1, the period before that a weighting of 0.8, the period before that a weighting of 0.64, and so on). From this is subtracted the number of casualties in any wars of choice, with 1% being subtracted for each 100,000 casualties during the Presidential term. The result of this subtraction gives the percentage of the vote that can be expected to go to the incumbent party.
Here is a graph showing how the "Bread and Peace" model has performed since 1952, with its last projection before the 2012 election:
 As you can see, the model stumbled somewhat badly in 2012, forecasting that Obama would win only 47% of the vote, when in fact he received about 53%, as shown in this "post mortem" graph below:
We have already seen that a number of economic indicators have a good track record of correlating with the election result, provided we know their values in the first 3 quarters of the election year. We have also seen that at least one long leading indicator, housing permits, has some validity in forecasting the election day status of changes in the unemployment rate, one of the best such economic indicators. We have seen that 80% of the time, just knowing whether or not the economy is in recession in Q3 of the election year has accurately forecast the popular vote winner in the election, going back over 150 years! Finally, we have seen that the long leading indicators through Q3 of 2015 suggest that it is more likely than not that this economic expansion will continue through Q3 of next year, and thus favor the election of the Democratic Party nominee.
There is one other well-known model, from economist Douglas Hibbs, called the "Bread and Peace" model. This model makes use of "real disposable personal income per capita" measured over the entirety of the last Presidential term, with weights for each period prior to the last measurement decreased by 20% (i.e., the last period before the election gets a weighting of 1, the period before that a weighting of 0.8, the period before that a weighting of 0.64, and so on). From this is subtracted the number of casualties in any wars of choice, with 1% being subtracted for each 100,000 casualties during the Presidential term. The result of this subtraction gives the percentage of the vote that can be expected to go to the incumbent party.
Here is a graph showing how the "Bread and Peace" model has performed since 1952, with its last projection before the 2012 election:

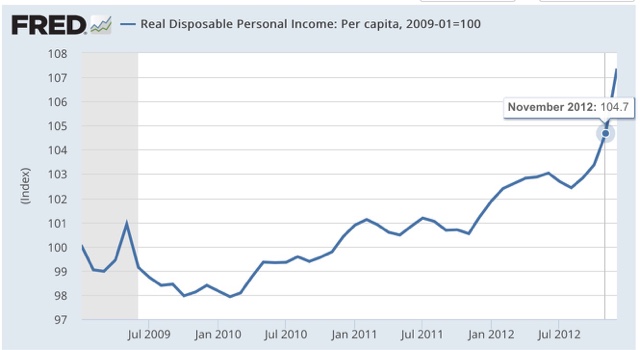
This is because "real disposable personal income" was one of the poorest-performing consumer measures of Obama's first term, growing by only 3% through August, before increaseing another 1.7% in September and October, to be up 4.7% on election day, with much of that increase coming in just the last few months before the election:
This highlights an unusal feature of the model. the last 3 months before the election count for fully half the wight of the entire result. Each successive preceding quarter counts for about half of th subsequent one. thus if real disposable personal income per capita grew linearly by 10% in the first 3 1/2 year s of a presidency, but did not grow in the lsat 3 momonths before the election, the model projects only +5% for this metric.
Since real per capita disposable income almost always grows outside of recessions and their immediate vicinity, this is n accord with our previous discussioin: a flat - or declining measure right before the election usually means a recession - which is exactly what the simple model indicating that a 3rd quarter recession in election year predicts the popular vote winner 80% of the time.
So what does the model suggest now? Let's take a look at 3 Presidential elections for which the model predicted similar results, and did not have a war (such as in 1968) to detract from the numbers.
First, here is 1988:

Next, here is 1996:

Finally, here is 2004:

In all 3 cases, "real disposable personal income per capita" rose fairly linearly throughout the preceding 4 years, with results on election day of +9.5%, +6.1%, and +7.1%, respectively.
Now here is the 2 years and 10 months of Obama's 2nd term:

Currently "real dispoable personal income is up + 6.4%.
We don't know what it's values will be for the next year. What we can say is that, *IF* real disposable personal income per capita continues to grow at the average rate it has since the beginning of 2013, it will be approximately +8.6% on election day, and the "Bread and Peace" model will favor a Democratic victory with the nominee receiving somewhere on the order of 53%-54% of the vote.
First, here is 1988:
Next, here is 1996:
Finally, here is 2004:
In all 3 cases, "real disposable personal income per capita" rose fairly linearly throughout the preceding 4 years, with results on election day of +9.5%, +6.1%, and +7.1%, respectively.
Now here is the 2 years and 10 months of Obama's 2nd term:
Currently "real dispoable personal income is up + 6.4%.
We don't know what it's values will be for the next year. What we can say is that, *IF* real disposable personal income per capita continues to grow at the average rate it has since the beginning of 2013, it will be approximately +8.6% on election day, and the "Bread and Peace" model will favor a Democratic victory with the nominee receiving somewhere on the order of 53%-54% of the vote.
Of course, this isn't a real forecast, since we won't know the final equation until election day next year. So we need to see if our leading indicators can help us out. And it also suggests that we should not rely on one single metric, but rather an index of metrics, to improve outocmes. As it happens, a British team has done just that with the Index of leading Indicators. Those will be the subjects of my next posts..