- by New Deal democrat
This morning the New York Times ran an article describing how poor wage growth is the best measure of how fragile this economic expansion has been for average Americans. I agree. Unfortunately in that article, unsourced, they reported that
... [I]n Friday’s jobs report..., the unemployment rate fell entirely because people stopped looking for work, not because they found jobs.What a load of crap. The BLS itself said that the decline in labor force participation in April was mainly because fewer than normal people entered it, rather than people dropping out. But this poor reporting is typical. The EPI wrote that its "missing workers" number (based on estimates from a research paper published 7 years ago) reached a new high in April, despite the fact that the economy has added over 225,000 jobs per month for the last three months -- well above any estimate of what is needed to absorb population growth. Meanwhile the popular blog Naked Capitalism calculates a rate of 12%+ for unemployment with an analysis that begins with an unspoken "assume there was no Baby Boom" and completely ignores the inevitable downward pressure Boomer retirements must place on the labor force participation rate.
So herewith, let me update the "real real unemployment rate.
In order to be counted among the unemployed for purposes of the monthly jobs survey, a person must have actively looked for a job during the reference period. But what about people who are so discouraged that they have completely stopped looking for work and have simply dropped out of the labor force?
The monthly household jobs survey measures exactly this in a statistic called "not in labor force, want a job now." Here's what that metric shows for the last 20 years:
The number of discouraged workers rose by nearly 2,000,000 in the wake of the great recession, but has declined by about 1/3 of that number in the last two years.
In order to find out what the "real" unemployment rate is, including such discouraged workers, we simply add the number of people shown above to both the numerator (unemployed) and denominator (civilian labor force, which excludes those adults not interested in jobs, like retirees) of the statistics used for the unemployment rate. Here's what that shows:
The usually reported unemployment rate (U3, in red) is currently 6.3%. The "real" unemployment rate including those who want a job but haven't looked (blue) is 9.8%.
While this is by no means good, it is important to compare apples to apples. Note that the current rate is equivalent to that of late 1994, and even at the height of the late 1990's tech boom, the best economy the US has seen since the 1960's, this rate was 6.7%.
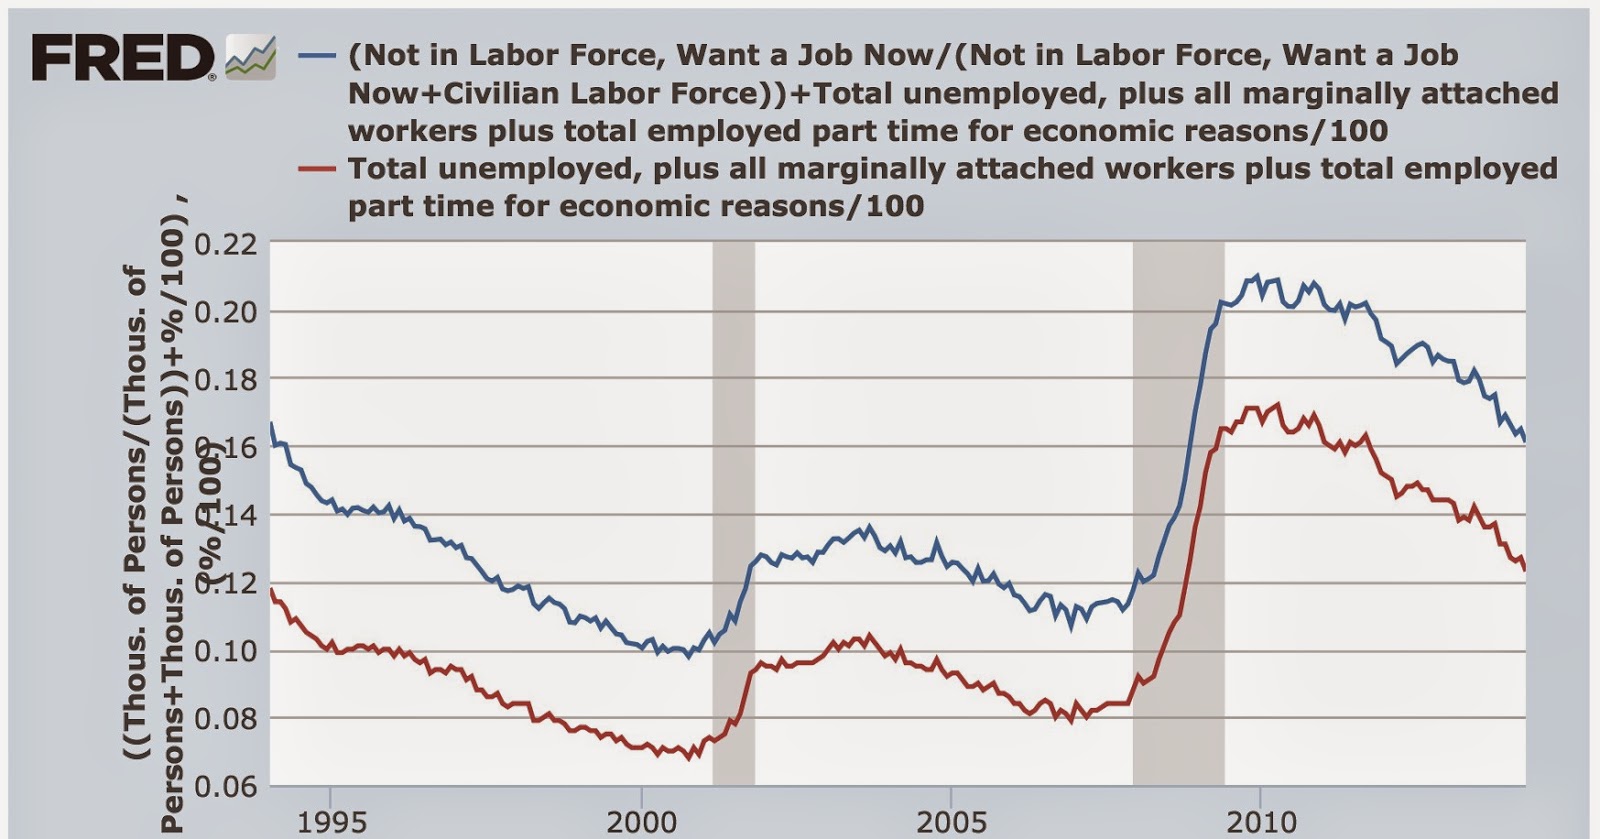
We can perform a similar calculation to get the "real underemployment rate," i.e., which adds those who are working part time for economic reasons or are otherwise marginally attached to the workforce:
The "real" underemployment rate is 16.1% (blue) vs. 12.3% (red). Again, note that even in the 1990's tech boom, this rate never got below 9.9%.
The calculation above is in accord with recent papers by the Atlanta Fed , researchers at the IMF, and Shigeru Fujita of the Philadelphia Fed that, while most of the increase in the "missing workers" initially was due to discouragement, in the several years there has been a relative increase in the number of retiring Boomers, thus reducing the number of those who are "not in the labor force, [but] want a job now."


