- by New Deal democrat
One of my key mantras is that I don't fight with the data. Sometimes there is an obvious asterisk (e.g., the government shutdown, or particularly severe weather, e.g., Sandy), but as a general rule trying to make the data fit your worldview will lead you astray.
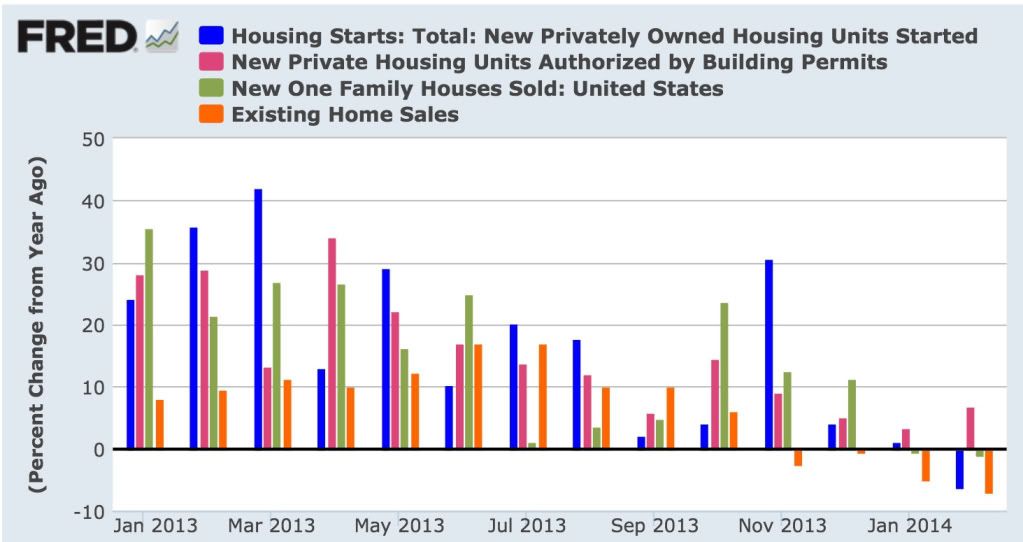
With that in mind, much as it pains me to say it, while housing starts and sales have been trending down as I thought they would:
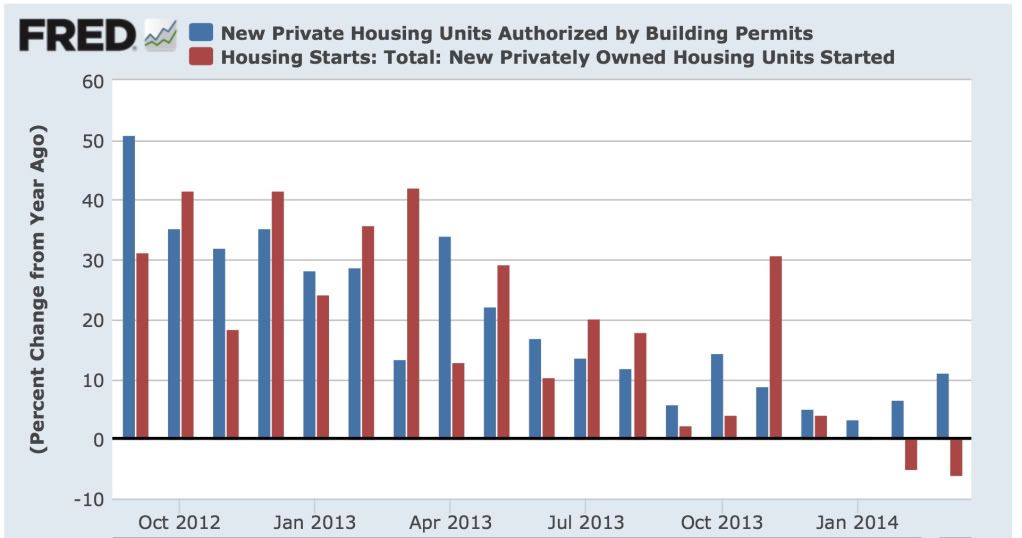
the best and most forward looking indicator, housing permits, has reversed course and trended upward in the last two months:
Last year I pointed out that on 15 of 19 occasions in the last 60 years, when there had been a 1% increase in interest rates, housing permits had decreased YoY by at least -100,000. One time, in 2000, permits decreased only -62,000. The three remaining times appear to be cases of "buy now or be forever priced out," in which the housing market levitated for awhile, and then crashed all the harder.
So here is what YoY interest rates (inverted) and housing permits YoY look like updated through March:
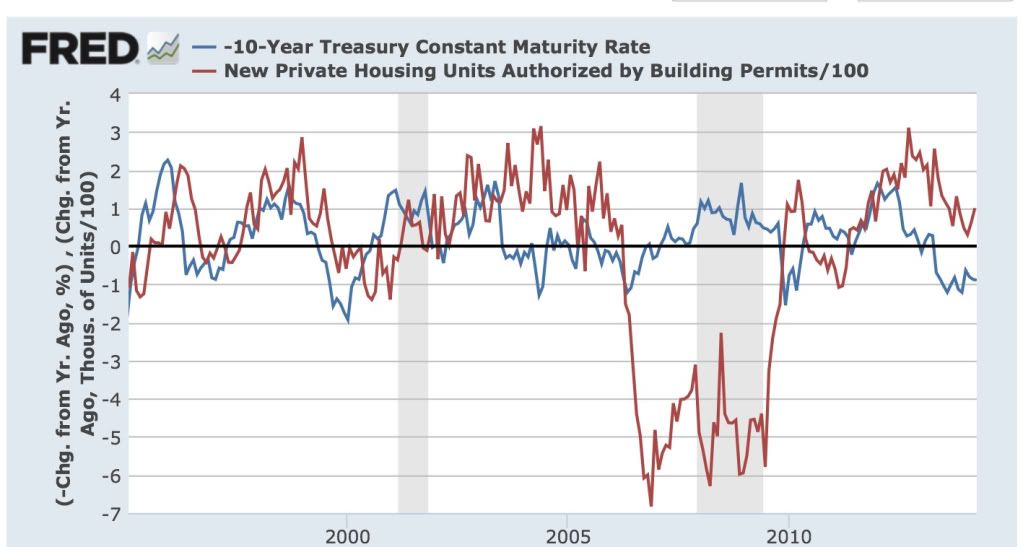
While permits have certainly decelerated, they have resolutely not turned negative, something that I absolutely thought would have happened by now.
(By the way, it's not like any of these have approached Bill McBride's forecast of a 20% average gain for 2014 over 2013 either. He may win his bet with me due to an isolated month of YoY comparisons, in particular June or July, where starts and sales in 2013 posted horrible numbers. But from here on in permits would have to exceed 1.1 million in a month for Bill to win the bet on that basis, and that seems very unlikely. And for the record, Bill is the nicest blogger there is and we are on good terms. This is a friendly bet for charity.)
So why have permits held up? A lot of the data is exactly what I'd expect to see as permits roll over. And there are reasons to think that the tow month YoY increase in permits might be an artifact of the unusually severe winter.
To begin with, builders appear to be seeing an actual slowdown. Here's homebuilder sentiment compared with housing starts (h/t Scott Grannis):
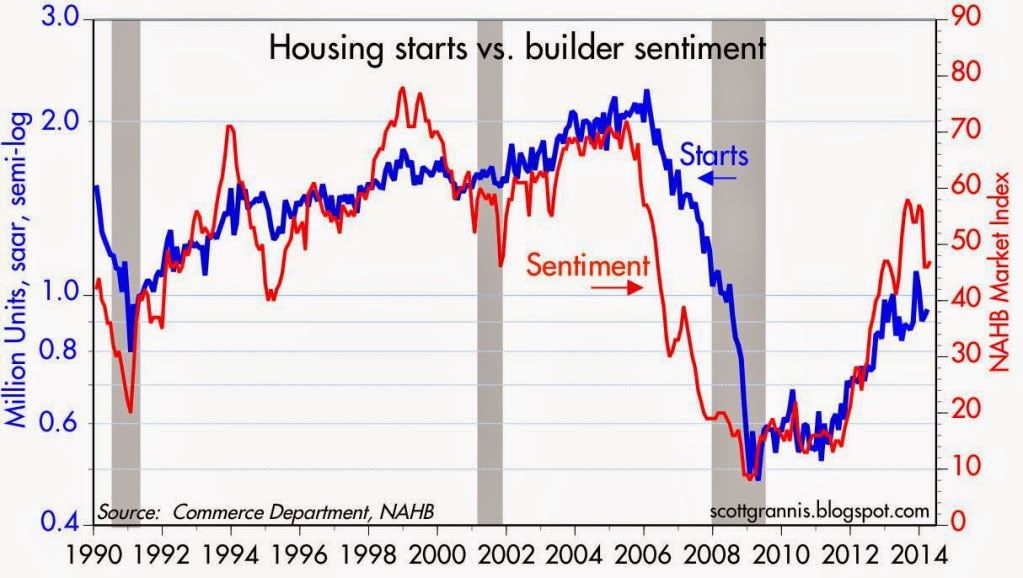
Note that the two generally move in the same direction, and homebuilder sentiment has decreased in the last few months.
More significantly, here is a graph of buyer traffic (via Paper Economy):
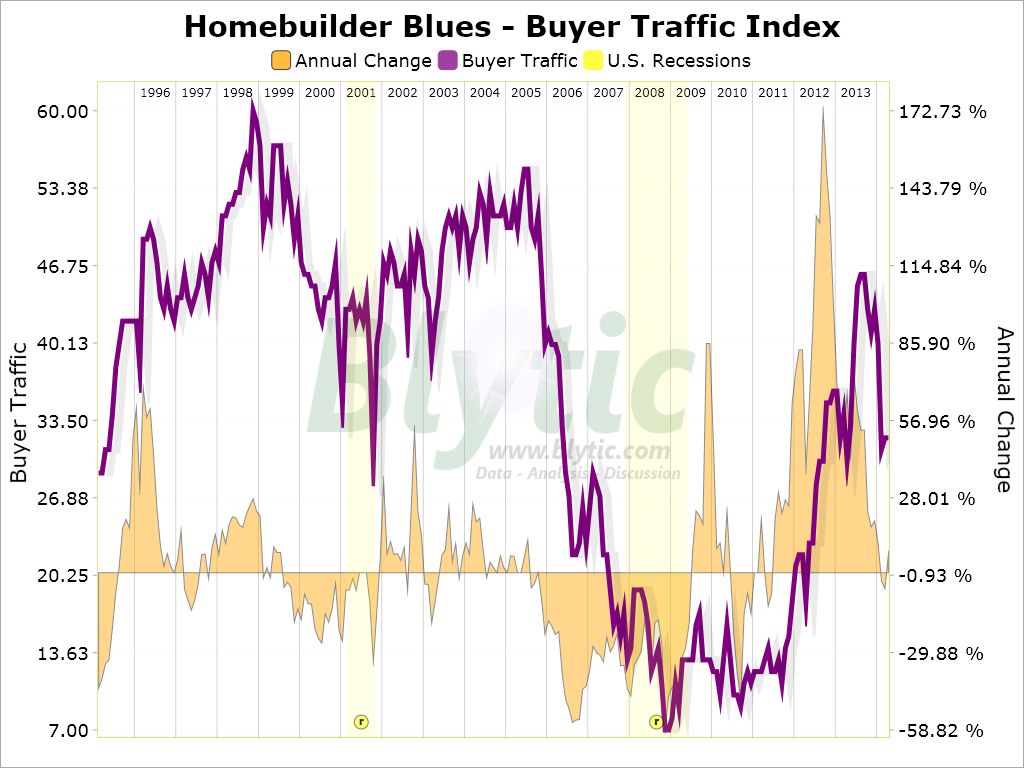
Buyer traffic appears to have decreased in the last few months, and is now basically flat YoY. This certainly does not look like what I would expect to see if there were to be an increase in housing starts or sales.
As to the unusual winter shifting permits in some regions from January and February to March, here are permits in the Northeast:
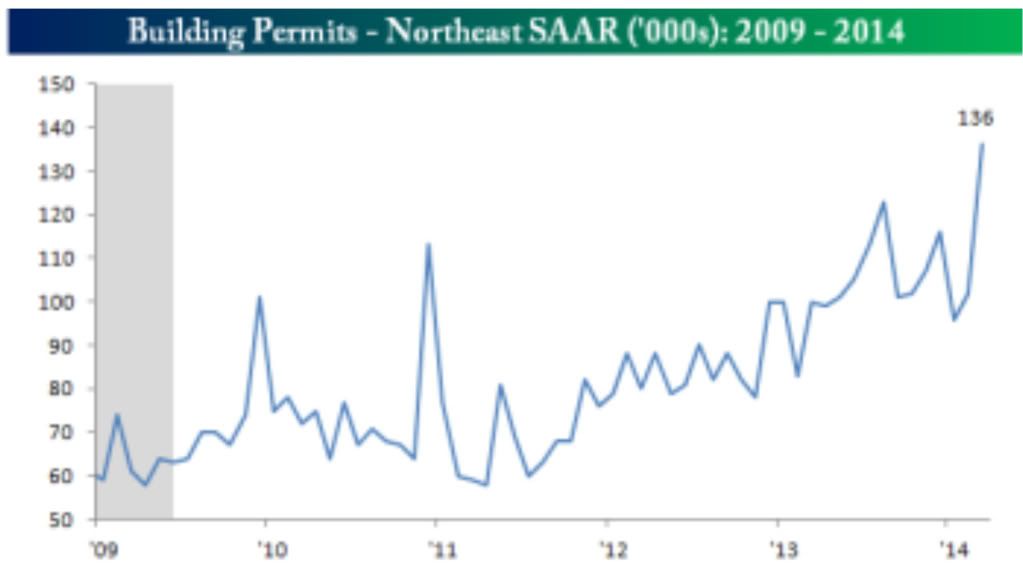
It looks pretty clear that there were several months of depressed winter data, followed by a huge rebound as the weather broke in March. Although I won't post it, a similar but smaller rebound occurred in the Midwest, while the South was negative YoY in March.
So there is reason to believe that the increasing trend in permits YoY since January might be an artifact of the unusually severe winter.
But on the other hand, in support of the reslience of housing permits, the below quote from this article in Redfin points out that several markets are experiencing outright booms:
While the housing market has cooled in many major cities since last year, other cities have only gotten hotter. In certain areas of Texas, North Carolina, Colorado and the Pacific Northwest, homes are selling like hotcakes thanks to strong job and population growth, worsening inventory shortages and ... relative affordability.And here is the accompanying chart showing the stats:
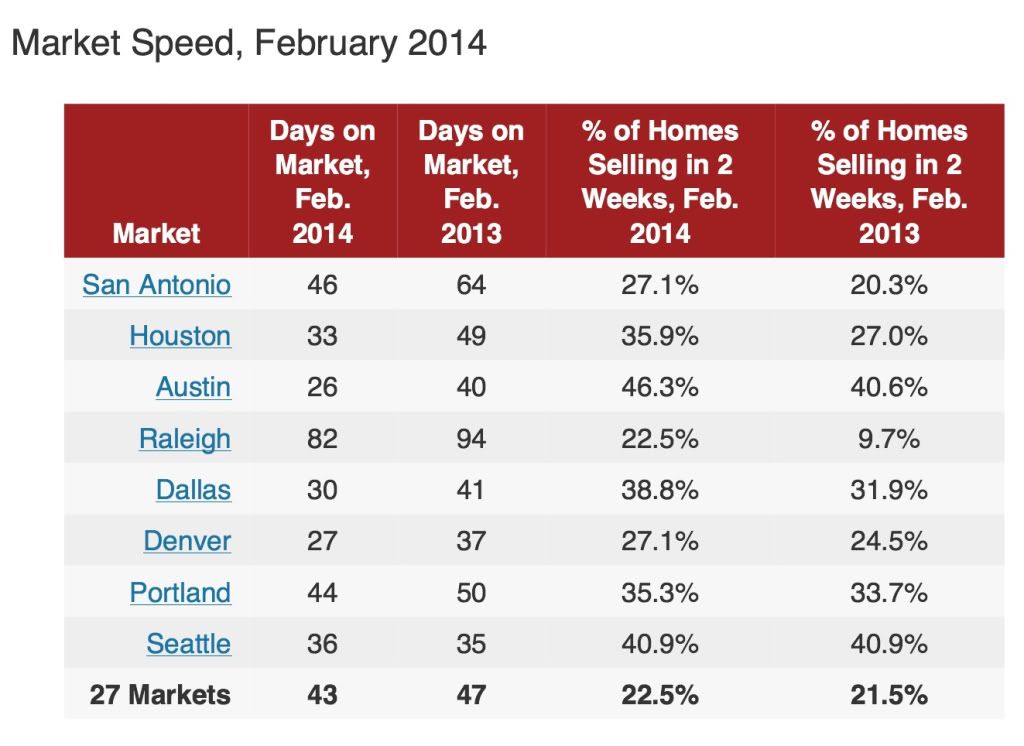
If there is a migration from high-priced to low-priced housing markets, this could be ameliorating the increase in mortgage rates.
Yet another factor may be the changing rent-vs.-own ratio. According to the US Census Bureau (pdf), while housing prices declined by about 1/3 from top to bottom, and have made up less than half of that decline since, median rents have remained within 5% of $700 per month since 2008. In the last few quarters of 2013, they rose to the top end of that range. In metro areas with relatively expensive rentals, buying a house may be more attractive.
Still, as noted by Realty Trac, the increase in mortgage rates has raised the minimum down payment to buy a house by about 20%:
Not coincidentally, the number of months' supply of houses has been slowly rising. In this week's reports of new and existing home sales, I will be particularly looking to see if this increase continues. There does not appear to be any magic number, as the below graph indicates, which compares the median house price change YoY (left scale) with the monthly supply of houses (inverted, right scale):The income needed to qualify for a median-priced home in the fourth quarter of 2013 was $41,500, up from an average minimum income of $34,250 a year earlier. (That minimum assumes you'll spend no more than 25 percent of your household income on your mortgage.)
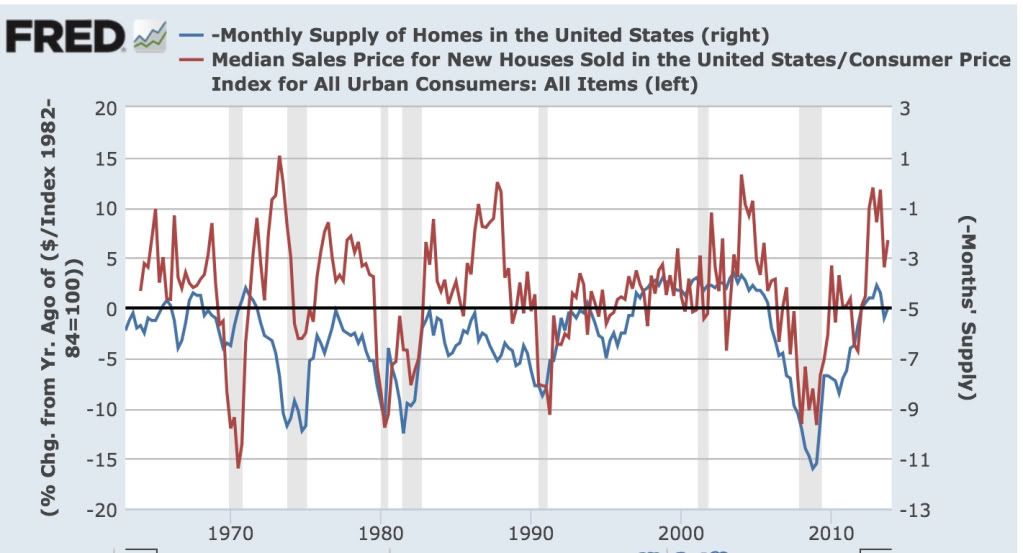
In the 1960s, 5 months supply was enough to bring prices increases to a halt. In the 1970s and 1980s, it was more like 7 months. In 2006, it was between 5 and 6 months' supply.
April and May of last year were particularly strong months for housing permits. If they are going to turn negative, those are the months where they should do so. If double-digit price increases continue, and affordability rapidly declines, then as with the prior 3 occasions, delaying the day of reckoning will only make it a harder fall.
So tomorrow and Wednesday, I will be paying particular attention to the median price months' supply of both new and existing homes. Is there evidence that the market has not withstood the most recent price increases? In the case of new homes, there is already evidence that there has been a peak, and YoY price increases may have ended. Is the months' supply steady, or is it increasing further? An increase in the months' supply is evidence supporting that there is or shortly will be a pullback in building.