
The technology sector is the largest sector of the SPY's accounting for a little under 20% of the average. Overall, this sector has dropped about 7.4%. Prices are right about the 200 day EMA and are also being hemmed in by the 10 and 20 day EMA. Also note the declining momentum and CMF. The real issue with this chart is the 200 day EMA; so long as prices stay above/near that level, I don't see any major problems.
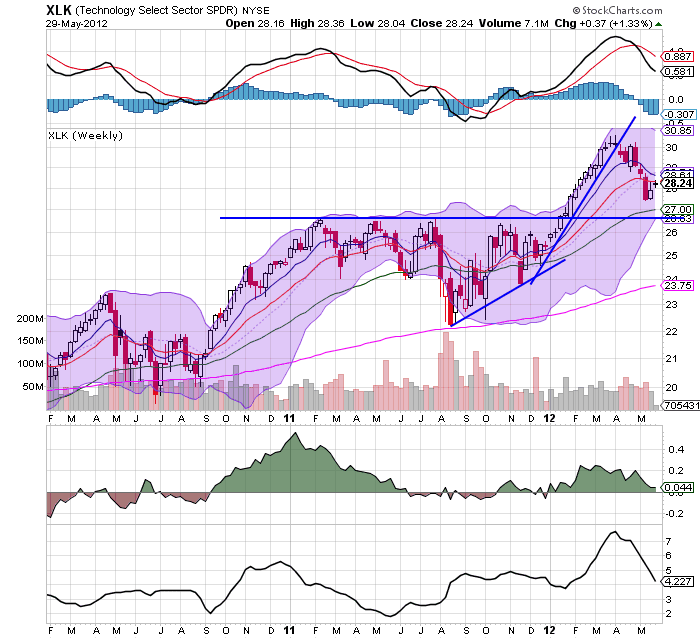
However, the weekly chart says the 26.75 price level is the most logical price target for this sector.

The XLFs (which comprise 14% of the SPYs) have broken through the 200 day EMA. Prices are currently in a rebound rally, but the deteriorating technicals (dropping MACD and CMF) tell us that the rally is purely technical. the 13.6 level (the 38.2% Fib level) is key; a move through that level would send the average lower.

The weekly XLF chart is also deteriorating; the MACD has given a sell signal and the CMF is declining. Prices rallied to the 200 week EMA, but were rebuffed. Prices are right at the 61.8% Fib level, but are contained by the 10, 20 and 50 week EMA.

The XLV, which account for 11.8% of the SPYs, are in a slightly downward sloping channel. But they have found strong support at the 81.8% Fib level.

The weekly chart shows that prices are at support levels established in mid-2011.
The two largest areas of the market -- technology and finance -- are clearly correcting. However, both have support on their respective weekly charts. The health care sector is moving lower, but its movement could also be classified as a holding pattern.