The US charts all show the beginning of this process, especially on the weekly charts.

After topping out near the 142.5 area, prices have moved lower and are now at the 10 day EMA. For the last few weeks, the chart has been printing very small candles, indicating a lack of overall momentum on the weekly price action. The MAD is about to give a sell signal as well. The lower graph -- the Bollinger Bank width -- tells us that overall price volatility is increasing. Also note the volume bars for the last My price target for this chart right now is 135 -- the price level reached in the late spring of last year.
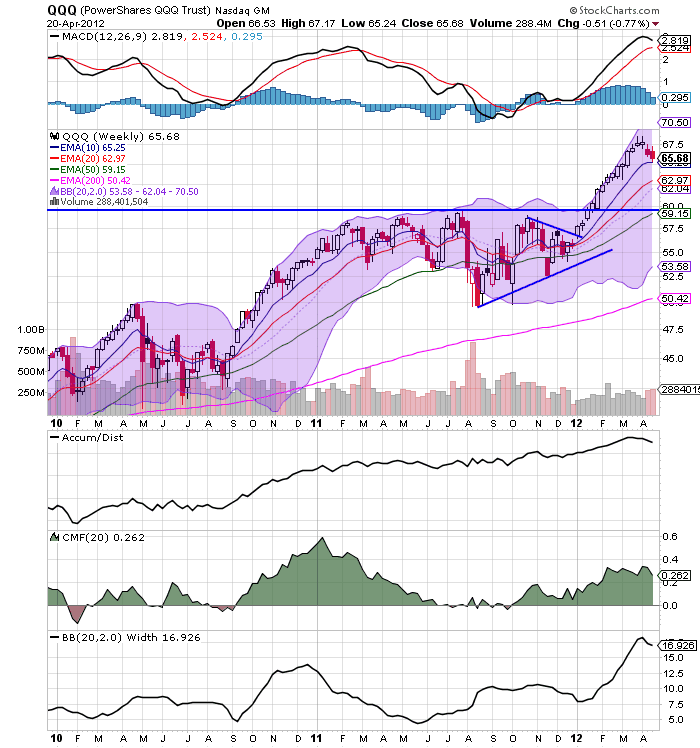
After topping at 69, the QQQs have now started to retreat and are currently standing on the 10 week EMA. The MACD is about to give a sell signal and we see a volume increase over the last two weeks. My price target here is 59.

This is the chart that first caught my attention. Prices could never get above key resistance areas. This was especially concerning as it indicated traders weren't committing capital to the riskier areas of the market. In addition, the MACD is currently giving a sell signal with prices between the 10 and 20 week EMAs.
The above combination of all three charts tells us that traders are concerned about the overall economic direction and are, at minimum, taking some profits off the table.
Let's look a little deeper into the market, taking a look at the three largest sectors: technology financials and health care and consumer discretionary.

The technology sector broke its uptrend in the first week of April, and has been moving lower in a disciplined manner ever since. The shorter EMAs are both moving lower, the MACD is declining and the volume indicators show profit taking. Also note the rising BB width, indicating increasing volatility in this sector.

After cresting in lat March, financials have been in a tight trading range (15-15.50) for most of April. The shorter EMAs are moving lower, momentum is declining as are the volume indicators. Prices are sitting right on the 50 week EMA.

Health care benefits from catching a safety bid in a down market. As such, we see that a shorter uptrend is still in place, but we also have declining momentum and volume indicators.

Consumer discretionary broken their uptrend at the beginning of the month and are now in a counter-trend rally. Prices are using the 10 and 20 day EMA as technical support, but we see declining momentum and volume indicators.
Of the four largest market areas, three have broken trend. The one that hasn't (health care) is a safety bid sector. In short, there is nothing in the above charts to indicate further rallies and everything to indicate consolidation. I should also add that I'm not stating a bear market is around the corner, but instead a correction.