It has been over 6 years since the housing bubble began to burst, triggering the worst financial panic in three-quarters of a century, and the deepest economic contraction since then as well. Close to 10 million people lost their jobs, and for the 99%, employed or not, neither income nor wealth has come even close to being recovered. In truth, the economy won't fully recover until housing recovers.
Where do we stand now? I don't think a broad view of this fundamental part of the economy has been covered anywhere for a long time. Let's take a look. Today I'll cover sales, construction, and employment. In the second installment, I'll look at prices.
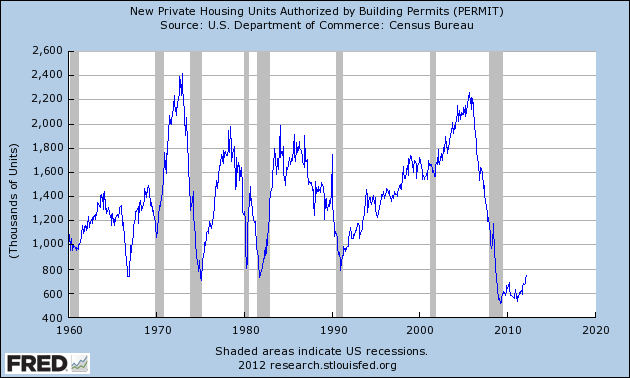
Permits are the most forward-looking data for housing. I would go so far as to say that, for forecating purposes, housing permits are the single most important economic statistic there is. Here's the long view covering over half a century. This is self-explanatory:
Now let's take a close-up view of the last 3.5 years. What we see is that, after the worst crash in over 50 years, permits started to trend upward a year ago and have now broken out of their 3 year range:
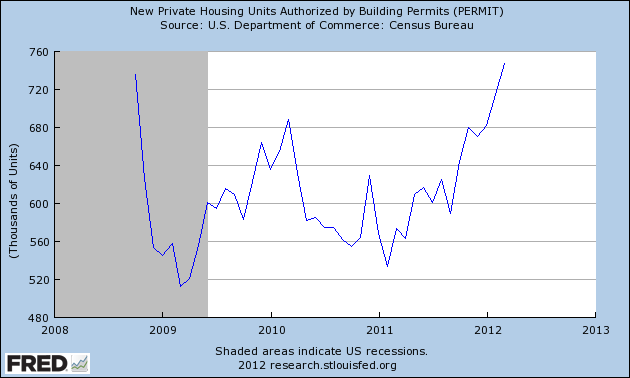
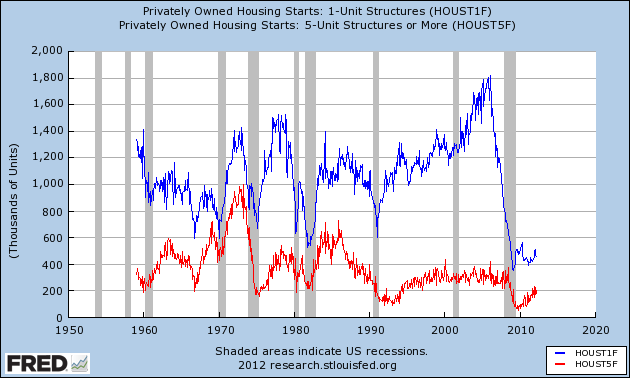
In short, the housing bottom is probably over. This doesn't mean the market will suddenly be flooded with new housing. It takes about 1 million new houses a year just to keep up with population growth and replacing demolished units. Put another way, for the first time in over 6 years, housing construction is putting some wind in the economy's sails. We can dig deeper. What we see when we divide housing starts into single family homes (blue) vs. multifamily units (red), is that most of the gains have come from the building of the latter:
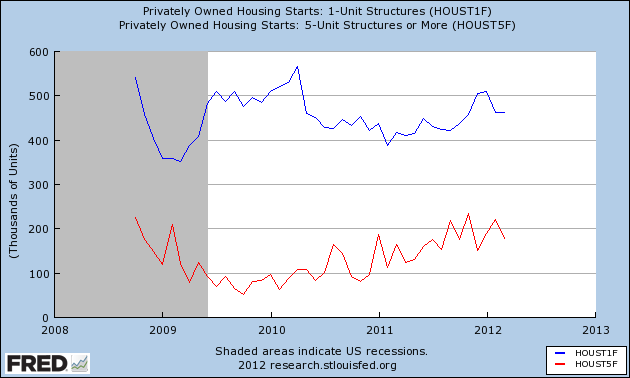
Here's the close up of the last 3 years. While both have gained from their respective bottoms in 2009, you can see that construction of multifamily units have more consistently gained, while single family home construction, while rising, isn't really out of its bottom range yet. That being said, in the last year we have seen about a 75,000 gain in construction starts for each category:
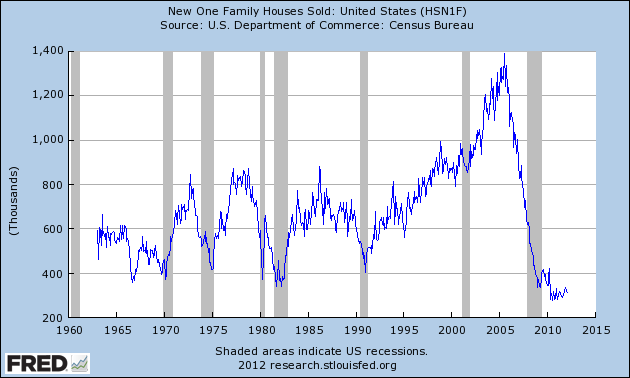
Another data series capturing the same move is the Census Bureau's measure of sales of single family homes. Like construction starts for single family homes, it really hasn't moved out of its bottom range:
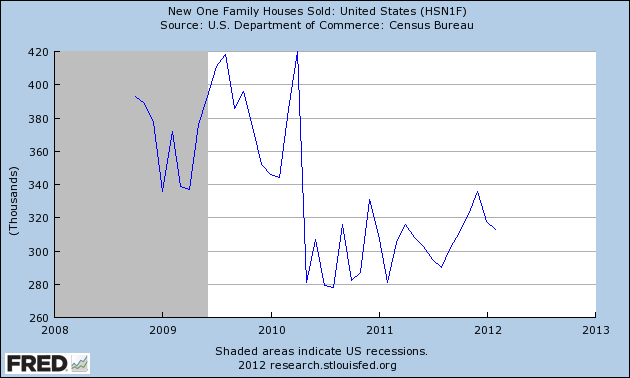
Here's a close-up of the last 3 years. As with single family construction starts, there was an initial bounce during the period of the $8000 housing credit, then a collapse back to the lows, and within the last year another uptrend without breaking out of the range (this series will be updated today):
Housing is such an important part of the economy because of the construction spending and employment that comes with it, as well as the subsequent and continuing spending on appliances, furnishings, tools, and landscaping. Here is residential construction spending:
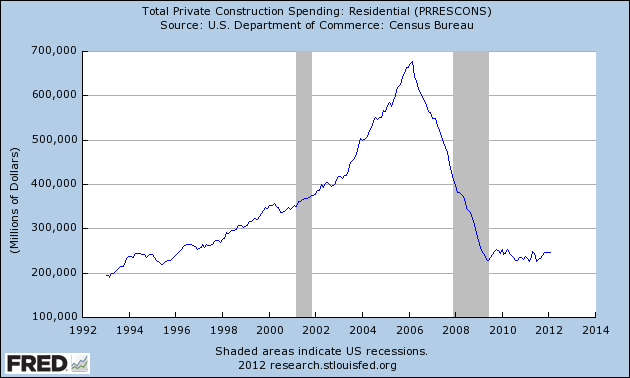
This mirrors very closely what we have seen in the housing starts data. The $8000 housing credit marked the end of the collapse, but there hasn't been an uptrend in construction spending yet. Now let's look at employment in the housing trades:
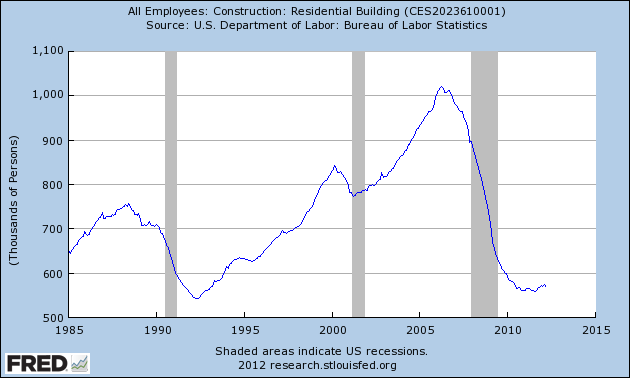
The small recent upturn is shown in more detail in this close-up:
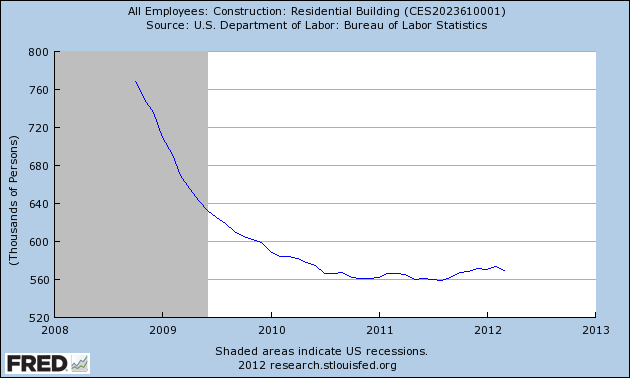
We are talking less than 20,000 jobs, but at least housing is no longer a drag on the employment picture.
Real estate loans made by banks are also supportive (note that the Federal Reserve Bank does not break down loans between residential and non-residential, so the below graph includes both):
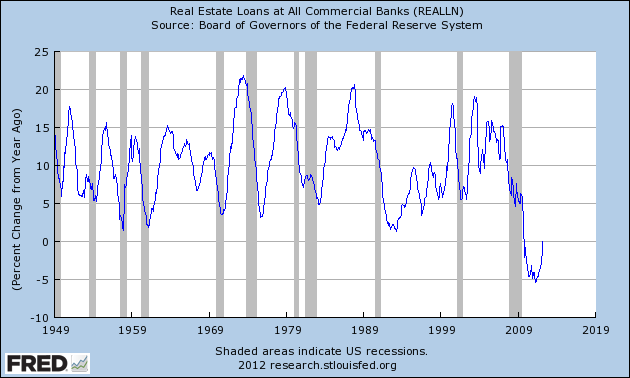
After 3 years of relentless decline, the YoY change in real estate loans finally broke even in March. As of last week, it is now up 1.0% YoY.
Purchase mortgage applications reported by the Mortgage Bankers Association are targeted, and show a generally flat trend within a range for the last 2 years (h/t Mortgage News Daily):
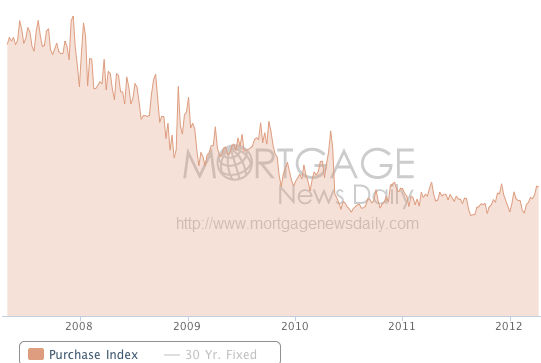
Please recall, however, that an unusually large number of houses, on the order of 33%, are being purchased with cash. Some of this may be due to speculation, but on the other hand, downsizing Boomers are also likely a large source of such sales.
Now let's put the picture together. In the below graph, all of the series are normed to 100 at their respective peaks. Note that permits (blue) lead construction spending (red) which in turn leads construction employment (green) at both the top and bottom:
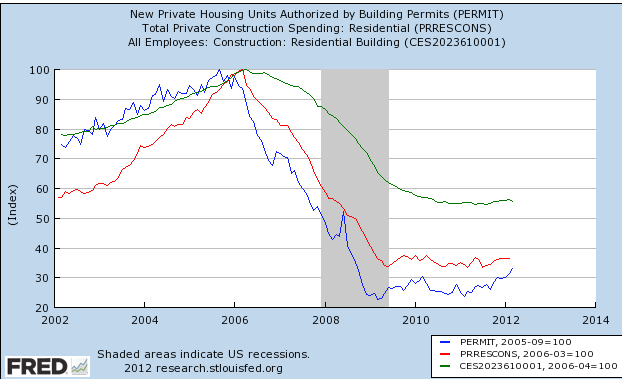
With permits trending upward out of their bottom range in the last year, we should expect to see increasing residential construction spending, and increasing construction employment, over the next year.
Next, let's look at the relationship between housing permits (inverted, blue, in the graph below) and the unemployment rate (red):
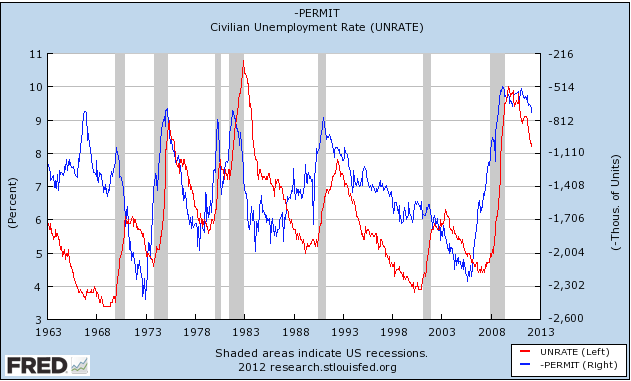
Permits are an excellent leading indicator for the direction, if not the range, of the unemployment rate over a year later. The increase in permits in the last year strongly suggests that the unemployment rate is going to continue to fall by at least a small percentage for the duration of 2012 and into 2013.
How much of an effect is the increase in housing construction likely to have on the economy? It turns out that simply by knowing the YoY change in the number of housing permits issued, we can make a close approximation of real GDP several quarters later. Take that number and add 100,000. Now divide the sum by 100,000. That will give you the YoY change in real GDP. Zero change in housing permits YoY implies +1% YoY GDP growth. Plus 100,000 permits implies 2% YoY growth, and so on, as shown in this graph below:
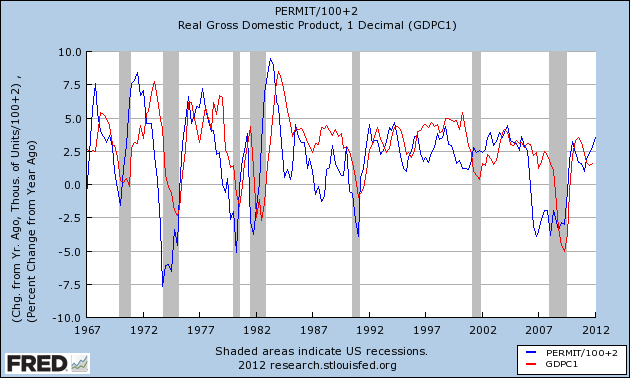
Big declines in housing permits seem to take longer, like 18-24 months, to be reflected in real GDP. Otherwise the lead time is about 2 quarters. Note specifically that every time in the last 50 years that housing permits have increased by over 200,000 in a year, YoY real GDP has increased by 3% or more shortly thereafter. Now here's the close up since the turn of the millennium:
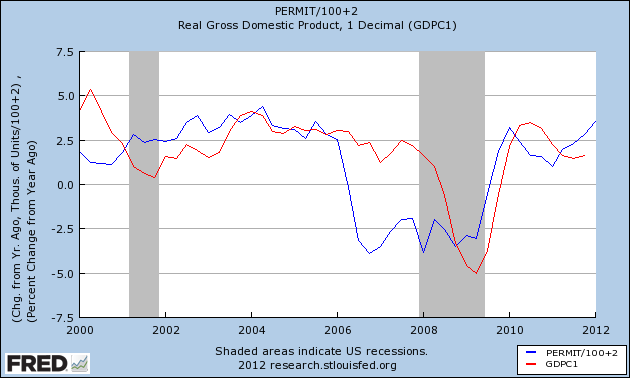
With an increase of over 200,000 in housing permits over the last year, YoY real GDP should be in excess of 3% at some point within the next 4 quarters.
In conclusion, when it comes to sales and construction, it looks like housing is finally breaking out of its bottom into at least a modest uptrend, thus putting wind at the economy's back for the first time in over half a decade.