Pending further revisions, the answer is "pretty darn close." I'm not using the shorthand description of "2 quarters of negative GDP", but rather the official NBER definition of a significant downturn in production, sales, income, and jobs.
As readers know, I've been proverbially scratching my head and trying to figure out ECRI's September 23 call (to subscribers) that a recession had either already begun or would begin by the end of the 4th quarter of 2011. Recently they've walked back that call and said a recession would start by the end of the the first half of 2012, but in September they were very clear that it would start by year end 2011. Also it would improper to call it a "forecast" of recession -- saying a recession may have already begun isn't a forecast, it's a report of an ongoing event, which begs the question, why hadn't they been forecasting a recession already?
In any event, their spokesman made very clear that he was using the NBER descripton of recession, which caused me to take a look at exactly what those 4 criteria were showing as of September 23 (which means, as of the August monthly data), and where we stand now.
Here's a graph of the 4 data series generally used by the NBER to determine if the economy is in a recession or expansion, through August:
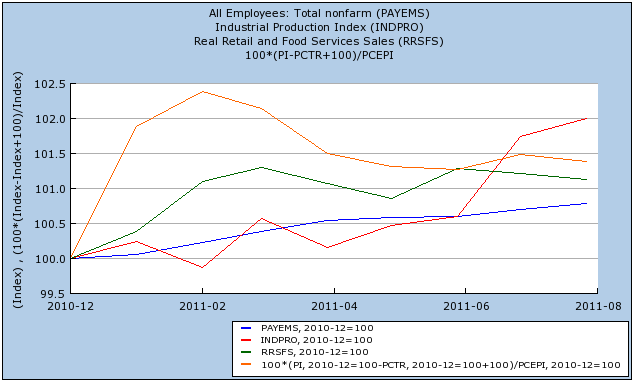
When the last data was released in September, it showed that real income (orange) had peaked in February, and had generally declined since. Real retail sales (green) had been flat since March. Industrial production (red) had been flat through June, increased in July, and declined slightly in August. Only nonfarm payrolls (blue) look consistently positive in this graph -- and that's only because of the subsequent revisions. In September, after May payrolls of +53,000, June had been revised down to +20,000, and July to +85,000 -- and it had just been reported that exactly zero jobs had been created in August.
Lots of other coincident data, like consumer confidence, rail traffic, and several regional Federal Reserve reports -- most notably one of the most horrific Philly Fed contractions on record -- had just been reported. No wonder ECRI was in a rush to get ahead of the apparent cliff-dive.
Three months later, the data doesn't look so bad:
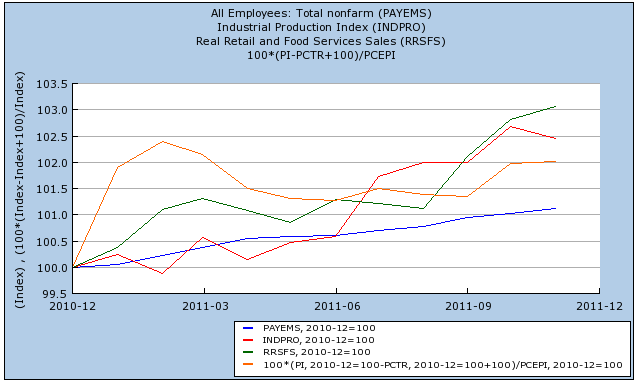
Generally speaking, all of the series had good months, especially in October. Only industrial production declined in November -- although real income is hanging on to positivity by a thread, and could easily be revised away. Of course, we also still have to wait for the December data, and the inevitable revisions -- so ECRI's original "forecast" isn't wrong yet.
Bonddad here:
When you look at last year's US data, you see, more or less, the following picture: a decent spring followed by roughly 6-8 months of stagnation in most indicators, followed by 4Q increases in a large number of metrics. The stagnation started with Japan's earthquake in the Spring that disrupted world supply lines and was followed by the US debt debacle at the end of the summer. Those two events provided a potent 1-2 punch to confidence in the economy and the US' ability to actually deal with its issues in a productive manner. The point is the economy withstood some fairly large external shocks which were spaced out enough to really hit the economy at bad points. Japan hit right as oil was increasing in price and gas at the pump was acting as a choke hold on the economy. After we started to get up from Japan we get hit with Congress behaving like children which knocked us down for another three months. It's only been over the last few months that we've seen an increase in consumer confidence -- and that is still an increase from very low levels.
Starting in roughly mid-December, I started to grow more bullish on the US economy, largely based on the breadth of positive indicators we were seeing. However, we've really only seen, at best, a month and a half of good data, so the jury ultimately is still out.