Last week I credited ECRI with its accurate call for a recovery stronger than the last two, through mid-year. At the same time, I have a problem with its Weekly Leading Index (WLI) which it publishes publicly - but then says that others should not rely on. This point was driven home by its collapse between April and July of this year, as shown on this graph:
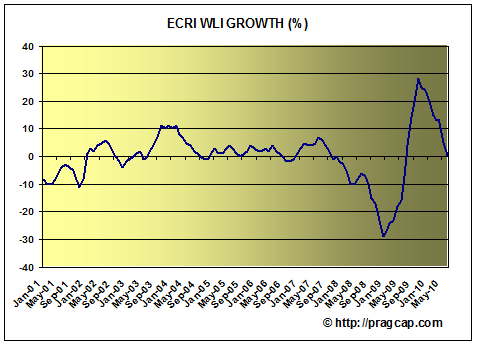
Through mid-April, it was showing stronger "leading" growth than in any recovery in 30 years. But GDP for the second quarter came in at less than 2%, and the third quarter might even be less. That isn't what I'd call "leading."
Citing that issue, back in early July, noting that virutally all economic data seemed to turn down in unison at the end of April, I highlighted 6 "harbingers of the second half stall:" (1) the Shanghai stock index; (2) Bond yields correlation with stock prices; (3) Price growth exceeded wage growth; (4) Real M1 and M2 money supply stagnant or shrinking; (5) Decline in housing permits and purchase mortgage applications; and (6) Oil prices at 4% of GDP. Since then, it became clear that there was another harbinger, namely (7) rising Libor index. These 7 items all deteriorated before the broad mass of data was hit.
With the LEI, and in particular the stock market, show a few signs of life, I thought it would be helpful to see what those "harbingers" are showing now. Let's take a look:
Here is the Shanghai stock index. It has been on a tear since the beginning of July, even more than the US market:
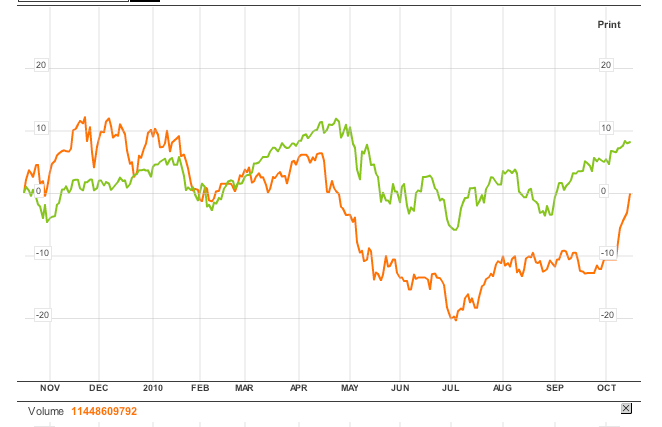
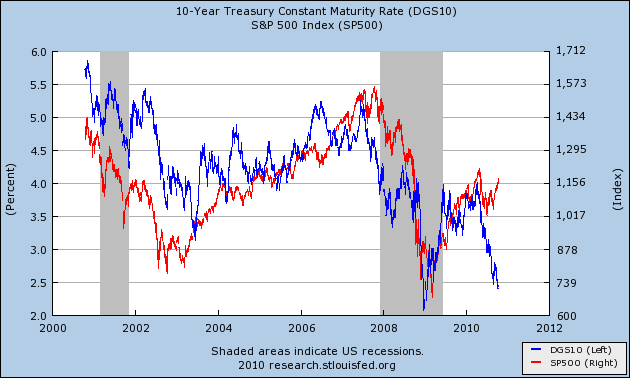
Here is a 10 year graph of stock prices vs. bond yields:
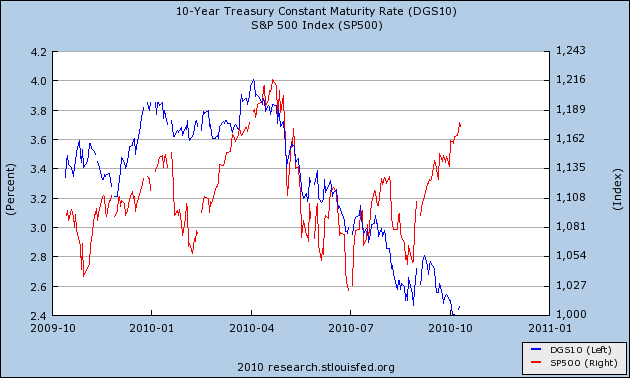
and here is a close-up of the last year. Notice how the two have moved in opposite directions since the beginning of July, vs. in unison since approximately last December (at the time of the Dubai crisis:
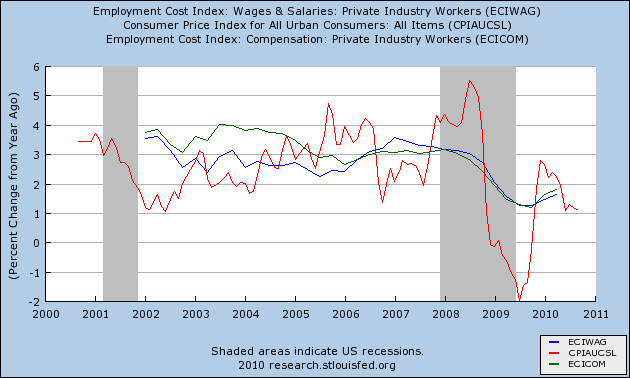
In the last few months, the retreat of any inflationary pressure means that wage gains have almost certainly slightly outpaced prices in the third quarter:
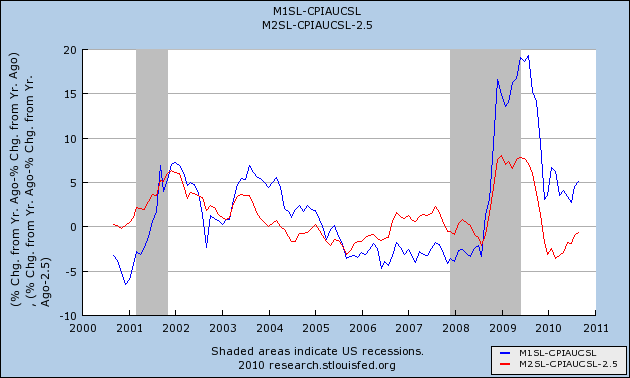
Real M1 and M2 have both turned up. Real M1 was always above the danger zone. Real M2 is getting close:
Housing permits have stabilized at a low level:
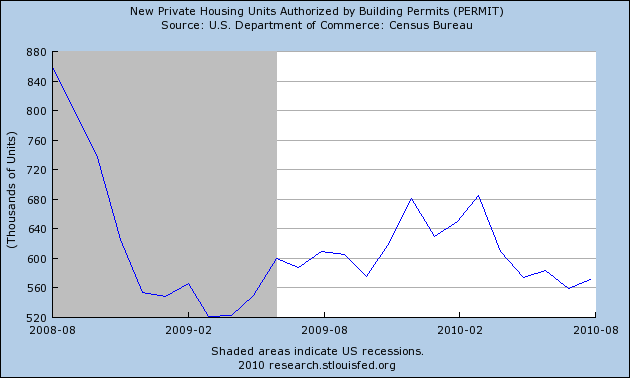
This morning's data is curious. Permits fell to 538,000, which is close to their 2009 lows. On the other hand, Starts - which typically follow permits closely, sometimes with a one month lag, at 610,000 were among the highest readings in two years. This is quite an anomaly and it will be interesting to see the revisions next month.
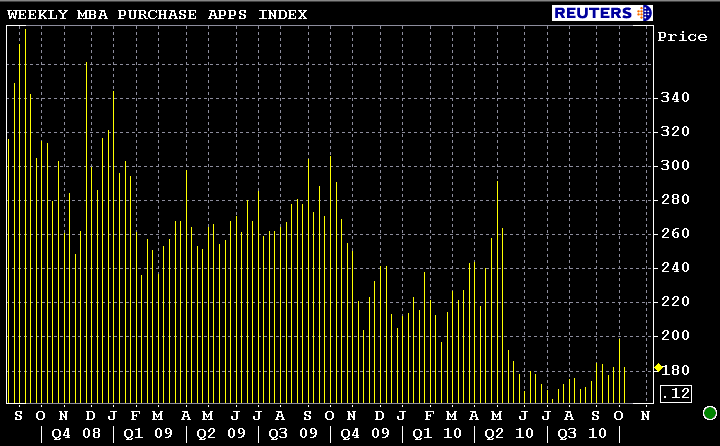
as have purchase mortgage applications:
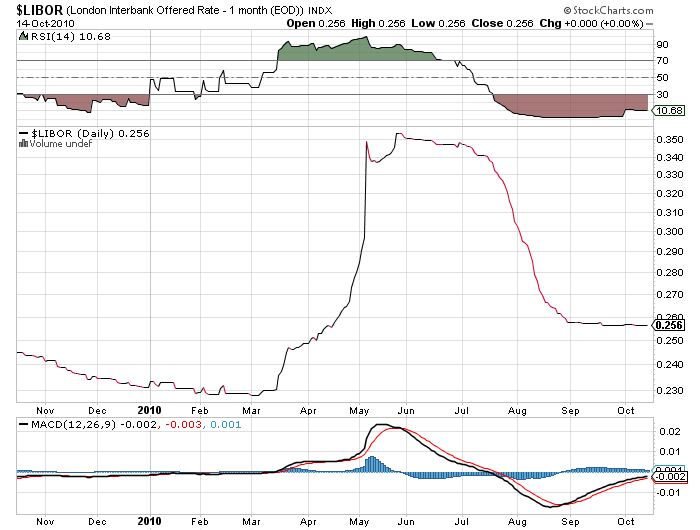
Libor is quiescent. If widening European bond spreads, or foreclosure issues were creating fear of a credit freeze, it would be showing up here. Nothing yet:
The one item that is of renewed concern is the increase in the price of Oil back over $80 in the last couple of weeks. The below graph is monthly through September:
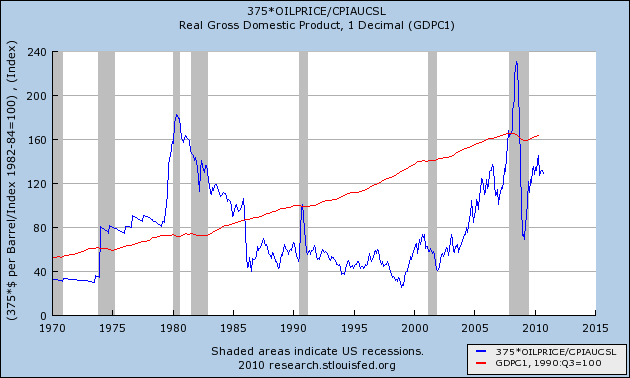
Note: in the above graph, whenever the blue line has exceeded the red line, that means Oil prices have exceeded 4% of GDP.
In summary, none of our harbingers indicates any further weakening of the economy. In fact, most of them are suggesting short term strength ahead. Yesterday's poor industrial production reading, a classic coincident indicator, is the fruit of the flatlining LEI of this spring, not a foretelling of next spring. Longer term, Oil prices are still a choke collar on economic growth, and "real" wage growth is pathetic at best.