As I've said in my last few posts, for the first time in over a year I am rethinking my overall view of where the economy is heading. It has been hit with at least 5 fresh concerns: (1) the Euro crisis (which I addressed a couple of weeks ago. I do not believe it is sufficient to cause more than a slowdown in growth here); (2) the aftereffects of the increase in Oil to nearly $90 or 4% of GDP (also not quite enough to put us back into recession); (3) the Oil cataclysm in the Gulf of Mexico - as to which I have no special insights, but it will clearly cost some GDP growth, with some counterbalancing spending on the vast cleanup that will be necessary; (4) the sudden slowdown in housing due to the expiration of the $8000 housing credit; and (5) the withdrawal/ending of stimulus help to the states and the long-term unemployed.
There are 5 data points, all but one of which will be available within the next 10 days, which may be crucial in determining which course the economy takes. They are:
1. retail sales ex-gasoline (this Friday)
2. weekly M1 and M2 (this Friday)
3. housing permits (next Thursday)
4. withholding taxes paid (by next Friday)
5. Congressional action on stimulus (by the end of the month)
So let's begin.
1. Retail sales ex-gasoline. Deflationary pulses tend to happen very quickly (that's why in the old days they were called "panics".) But it isn't like there is no warning at all. The Panic of 2008 really took off in September, but retail sales declined in May and accelerated that decline throughout the summer (averaging nearly -1.0% a month) before falling off a cliff in September:

I've been harping for close to a year now on how real retail sales lead employment and have for at least 60 years. In short, retail sales will give us a warning, and as the graph above shows, real retail sales have remained positive this year.
While most pundits expect the CPI (reported next Thursday) to be +0.1, that seems inconceivable to me. Gasoline is off about 10% for the month. Owner's equivalent rent has been running at 0.0 or -0.1 for half a year, and I don't see that changing. In the similar 2006 decline in Oil, CPI came in at -0.4% and -0.5% in the critical months.
Pundits also expect retail sales to be reported at +0.4% (Marketwatch) or +0.3% (Briefing.com) this Friday. In the past few years, typically about half of the positive or negative impact on retail sales has come via gasoline sales. Including gasoline, the "expected" number seems just about impossible, so I expect retail sales to "disappoint."
Take out gasoline, however, and the likely downdraft in both CPI and retail sales should cancel one another out. The "real" number to watch will be retail sales ex-gasoline. If it's a negative number, then that is a warning. If it is a positive number, however, then real retail sales for May will be up again, and YoY sales should still be over 5% (although there may be a small decline, since May 2009 real retail sales were +0.6%). If retail sales ex-gasoline shows consumers are still "in the game", then a double-dip looks quite unlikely.
2. Weekly M1 and M2. One graph of Doomer porn has been the steep decline in the continued M3 series. The problem is, generally in the past M3 has been a poor portent of recessions and recoveries. "Real" M1 and M2 have much better records. If "real" M2 is up less than 2.5% YoY, and "real" M1 is negative, that is a bad sign. In fact, M2 is one of the 10 series in the LEI.
The second derivative of both of these numbers has been declining this year. Through April, real M2 is actually negative. Real M1 is up about 2%. The decline in M2 has been the chief reason for the easing of the Leading Indicators this year, and in particular for the negative reading in April.
With one week to go, however, in May both numbers have trended very positive, and look to go right back to their highs of February. This Friday we get the last weekly number for May. If it's good, then the odds of a double-dip recede -- and let's hope Ben Bernanke keeps his foot on the accelerator.
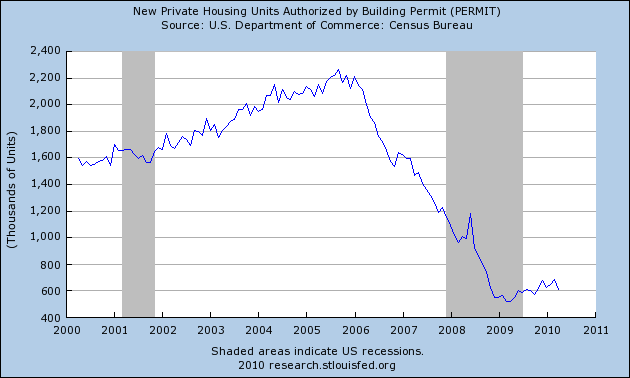
3. Housing permits. Leading Indicators also went down in April because of a decreases in two other componets. One was the ISM vendor performance index (from white hot to red hot, but it's listed as a negative. Go figure). In May that went sideways, so it is a non-issue. The other leading component that tanked was housing permits, declining from 685k to 610k in response to the expiration of the $8000 housing credit (The all time low was 522k in March 2009):
By contrast, the Mortgage Bankers Association's index of purchase mortgage applications has continued to fall to all time low's in the last 5 weeks:
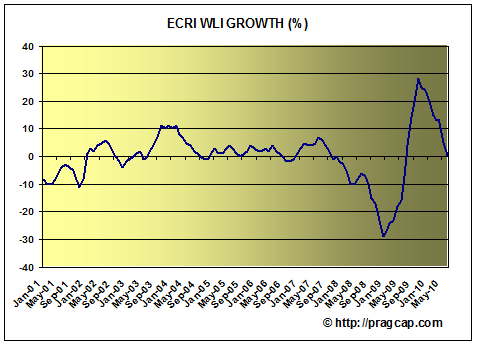
Since ECRI apparently includes the MBA's purchase mortgage index as part of its own leading economic index, ECRI's index fell all the way to ZERO from red hot growth in just one month:
I had a brief email exchange with Bill McBride a/k/a CR about the relationship between the purchase mortgage index and housing permits, and he advises me that there is a correlation, but it is "loose."
While the recovery from the early 2009 bottom in housing permits and starts has been relatively lackluster, as indicated in the graph of permits above, it has nevertheless been a recovery. If we are going to have a double-dip, I would expect permits to follow the MBA index to new lows. On the other hand, if the consensus estimate of 655k permits issued in May turns out to be correct, and there is a rebound in housing permits this month, then the odds of a double-dip become very low.
4. Withholding taxes. This isn't anything new, I've been watching these for months. But after March's YoY advance of +5% and April's of +4%, May ended with a pitiful YoY advance of less than 1% compared with one of the two worst months during the entire recession and immediate aftermath. Furthermore, that downturn was concentrated in the last half of the month. It coincided with a very disappointing May employment report showing only +20,000 non-Census jobs. Interestingly, Trim Tabs research, which I've criticized in the past for how they make use of withholding data, nailed this one, having called for only 75,000 to 125,000 private sector jobs to have been created in May, in advance of the official BLS report.
If May presaged a double-dip, I would expect withholding taxes to continue to roll over. On the other hand, if employers simply froze for a couple of weeks in May in response to Doom in Europe, then there should be a rebound. By the end of next week, we may have enough information to know.
5. Congressional stimulus. The budget years for 46 of the 50 states start on July 1. While most states' revenues hit bottom in the first quarter of this year, and almost all are now reporting YoY gains in tax revenue on a monthly basis, they are at their absolute nadir in being able to support existing programs, and their combined budget shortfalls beginning July 1 are approaching $90 Billion!
Last year the federal stimulus package included money directly aimed at states, which in turn could be released to their various municipalities. As a result, many teacher and other positions that would have been ended were saved. If the stimulus is not replaced, those positions will now be eliminated, dealing public services a critical blow, not to mention that public employees spend money in the economy too -- in other words, the multiplier effect applies to them too.
The number of government employees now exceeds the number of manufacturing employee, so the impact is by no means trivial. Hopefully if the states receive aid this year, by next year their budgets will have sufficiently recovered that no further aid will be necessary. There is no reason Congress couldn't extend the aid as loans, either, to be paid back over (say) the next five years.
Congressional action on this specific front would be a great aid. On the other hand, if Congress succumbs to austerity chic, it will send a very bad signal.
If the above 5 data points come up on the optimistic side, then we are just in a rough patch, a temporary slowdown that in no way derails the recovery. On the other hand, should all five come up on the pessimistic side, then watch out for a possible double dip.
For now, I am leaning on the optimistic side -- a slowdown or at worst one quarter of slightly negative GDP -- but no double dip. I'll discuss each of these data points as they come in.