This week is probably going to end with some good news about employment. When nonfarm payrolls are released on Friday, almost everybody, even pessimists, expects it to be a positive number. In part this is a triviality, because the Census Bureau has probably hired about 100,000-150,000 people this month. But even without that added (and very temporary) boost, most forecasters are looking for actual job growth in March. As I type this, according to Briefing.com, the median forecast for the private ADP employment report, which does not include government jobs, is +40,000. The median forecast for nonfarm payrolls including the census workers, is +190,000, meaning somewhere between +40,000 and +90,000 jobs other than the Census are expected to have been added to the economy this month. Most forecasters are also calling for unemployment to be unchanged at 9.7%.
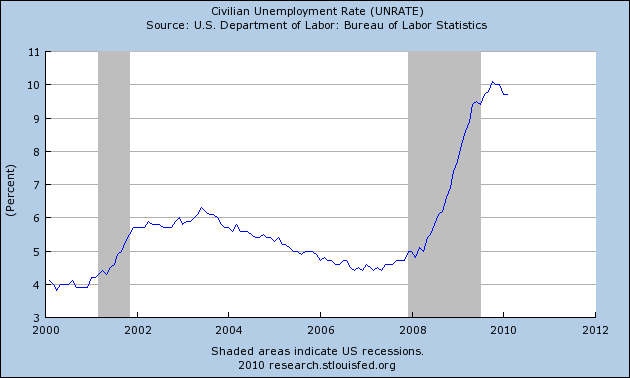
Turning to the unemployment rate first, according to the Economic Cycle Research Institute, which made a stellar call[pdf] last spring when it predicted an end to the recession last summer -- it would be unprecedented for the unemployment rate to climb back up to its October levels.
The broader U-6 unemployment measure also appears to have peaked, at 17.2% last October as well:
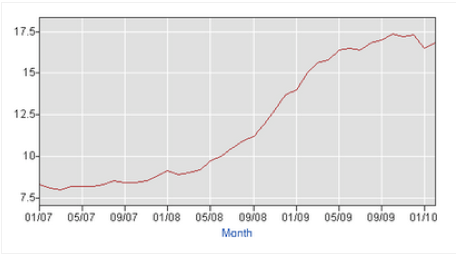
If this is indeed true, then the unemployment rate will have peaked only 4 months into the economic expansion -- much sooner than either of the 1992 and 2002 "jobless recoveries," in which the unemployment rate peaked 15 months and 21 months after the recessions' end, respectively.
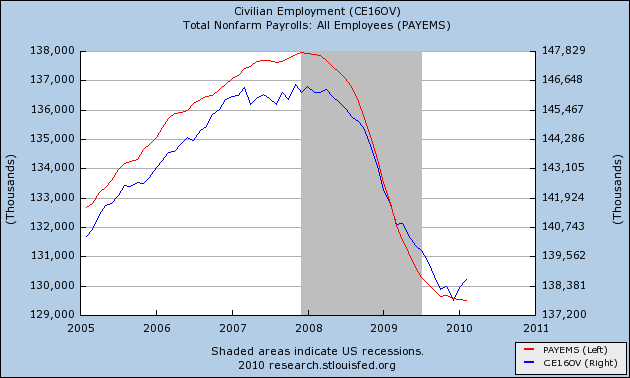
Turning to jobs, a variety of other indicators also are strongly suggesting that job growth is beginning and will last at least a while. The employment data from the separate household survey turned positive 2 months ago - traditionally something that signals the imminent turn in the nonfarm payrolls survey:
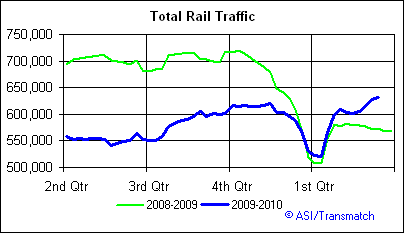
Railroad carloads for March have been improving, and also compared with last year:
“You have never had a four-tenths-of-a-point decline in the rate and then see it go up to a new peak since the end of World War II, [ECRI Research Director Lackshman] Achuthan said [on March 9]... “The unemployment rate already peaked.”Indeed, the drop in the number of longer term unemployed also suggest that the high water mark for U-3 unemployment appears to have peaked at 10.2% last October:

The broader U-6 unemployment measure also appears to have peaked, at 17.2% last October as well:

If this is indeed true, then the unemployment rate will have peaked only 4 months into the economic expansion -- much sooner than either of the 1992 and 2002 "jobless recoveries," in which the unemployment rate peaked 15 months and 21 months after the recessions' end, respectively.
Turning to jobs, a variety of other indicators also are strongly suggesting that job growth is beginning and will last at least a while. The employment data from the separate household survey turned positive 2 months ago - traditionally something that signals the imminent turn in the nonfarm payrolls survey:

Railroad carloads for March have been improving, and also compared with last year:

Receipts for withholding taxes, which had also lagged, look very much like they will be about 2% or more better this month than in March 2009. The Conference Board reported that their "Employment Trends Index" also suggests imminent job growth, and the Challenger Gray and Christmas firm, which keeps track of large layoffs, says they have shriveled, that companies are beginning to convert temporary hires into permanent ones, and that we are "poised for job growth."
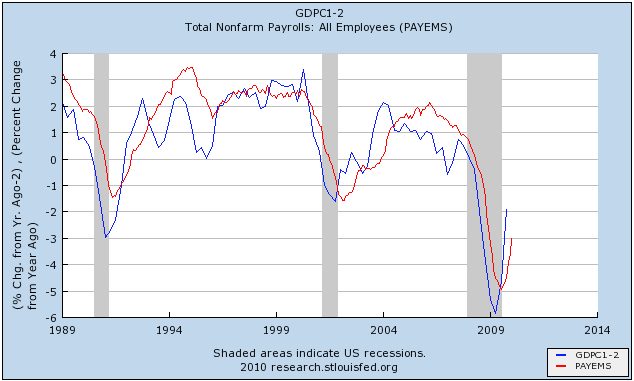
As reported by Barrons, most forecasters are calling for GDP to run just short of 3% this year, and even pessimists have it in excess of 2%. While that isn't stellar, it will mean that YoY GDP as of now is approximately 2.5% -- historically enough growth to suggest that there will YoY job growth in about the 3rd quarter of this year, as shown in this graph which subtacts 2% from YoY GDP (blue) and compares it with YoY job creation (red):
- which to be achievable would have to start now.
Additionally, the Leading Economic Indicators, while soft in January and February, have remained positive, and early indications are that March will be a good month as well. That is an excellent indication that there will also be GDP growth in the second quarter, which will make the YoY GDP comparison even better in 3 months, suggesting that job growth is going to continue at least well into the second half of this year.
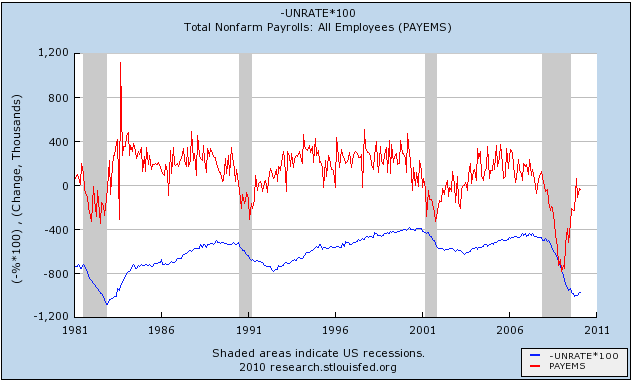
If real job growth is reported on Friday, it will mean that jobs will have been added to the economy 9 months after the trough in GDP at the end of the second quarter of last year -- longer than the 2 months it took in the 1992-93 "jobless recovery", but much shorter than the 21 month lag in the 2002-03 "jobless recovery":
All of this is legitimately good news. While it is by no means a "V-shaped" jobs recovery, it is nevertheless considerably "less bad" especially as to unemployment than just about everybody imagined. In political shorthand, the stimulus has worked.
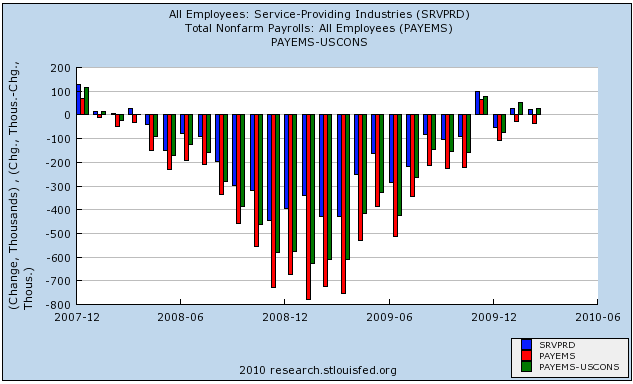
But one area that is continues to lag, and is going to be a drag on the economy at least for the remainder of this year, however, is construction. In fact, leaving aside construction, the economy actually started to show job growth at the end of this year, as shown on this graph of monthly jobs added/lost in which overall payrolls are in red, jobs in the service sector in blue, and all jobs minus the construction sector in green.
As reported by Barrons, most forecasters are calling for GDP to run just short of 3% this year, and even pessimists have it in excess of 2%. While that isn't stellar, it will mean that YoY GDP as of now is approximately 2.5% -- historically enough growth to suggest that there will YoY job growth in about the 3rd quarter of this year, as shown in this graph which subtacts 2% from YoY GDP (blue) and compares it with YoY job creation (red):

- which to be achievable would have to start now.
Additionally, the Leading Economic Indicators, while soft in January and February, have remained positive, and early indications are that March will be a good month as well. That is an excellent indication that there will also be GDP growth in the second quarter, which will make the YoY GDP comparison even better in 3 months, suggesting that job growth is going to continue at least well into the second half of this year.
If real job growth is reported on Friday, it will mean that jobs will have been added to the economy 9 months after the trough in GDP at the end of the second quarter of last year -- longer than the 2 months it took in the 1992-93 "jobless recovery", but much shorter than the 21 month lag in the 2002-03 "jobless recovery":

All of this is legitimately good news. While it is by no means a "V-shaped" jobs recovery, it is nevertheless considerably "less bad" especially as to unemployment than just about everybody imagined. In political shorthand, the stimulus has worked.
But one area that is continues to lag, and is going to be a drag on the economy at least for the remainder of this year, however, is construction. In fact, leaving aside construction, the economy actually started to show job growth at the end of this year, as shown on this graph of monthly jobs added/lost in which overall payrolls are in red, jobs in the service sector in blue, and all jobs minus the construction sector in green.

Back in September, I predicted that the bottom in jobs would be in November or December, +/- one month. Sure enough, service jobs turned positive in November. Indeed, leaving out construction, the economy as a whole actually added jobs in both January and February. But because of ongoing losses in the construction sector, the economy has still shed on average about 30,000 jobs a month since October.
Therein lays one way in which this recovery has been nearly unique -- the continuing weakness in housing, and the ongoing collapse of commercial construction, Typically in post WW2 recessions, real residential investment (investment in housing) led the way, first as evidenced in housing permits, and then in the manufacturing and transportation of goods to build the houses. Commercial construction began its own cycle about 12 to 16 months thereafter.
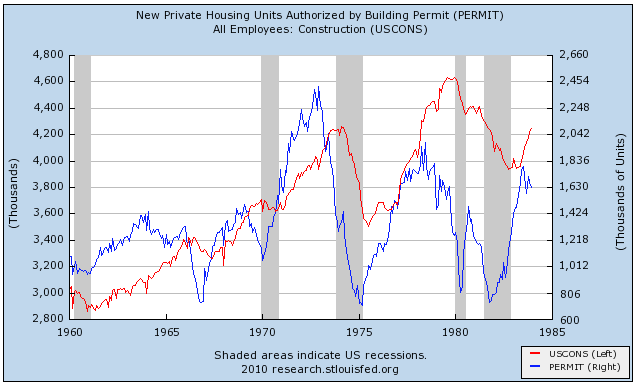
Therein lays one way in which this recovery has been nearly unique -- the continuing weakness in housing, and the ongoing collapse of commercial construction, Typically in post WW2 recessions, real residential investment (investment in housing) led the way, first as evidenced in housing permits, and then in the manufacturing and transportation of goods to build the houses. Commercial construction began its own cycle about 12 to 16 months thereafter.

In the typical expansion, housing permits surged 50% or even 80% year over year as the expansion began.
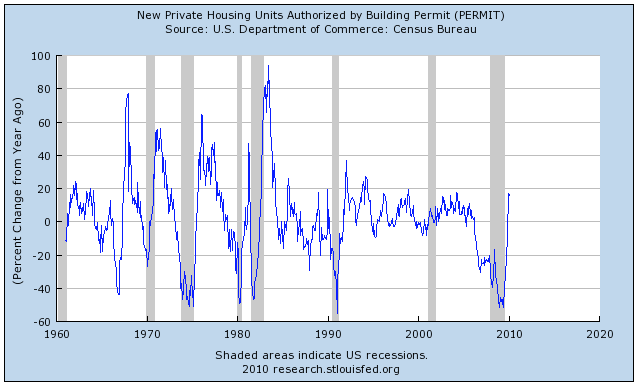
Not so now. While real residential investment and housing permits both bottomed in the second quarter of last year, permits have only risen less than 20% year over year as of February. In short, this is the weakest housing recovery since world war 2.
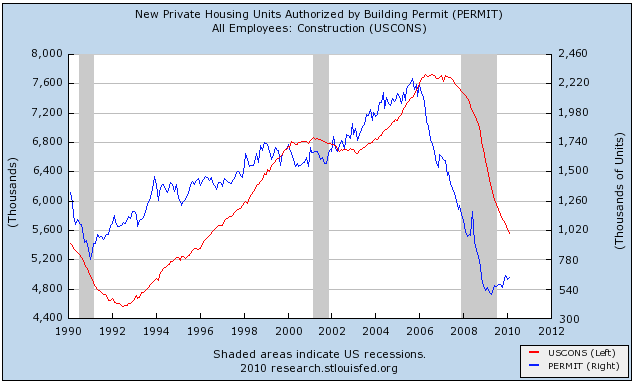

Not so now. While real residential investment and housing permits both bottomed in the second quarter of last year, permits have only risen less than 20% year over year as of February. In short, this is the weakest housing recovery since world war 2.

If residential investment is tepid, commercial construction is still in a state of collapse. As this graph courtesy of Calculated Risk shows, architectural billings tend to lead commercial construction by about 9 to 12 months.
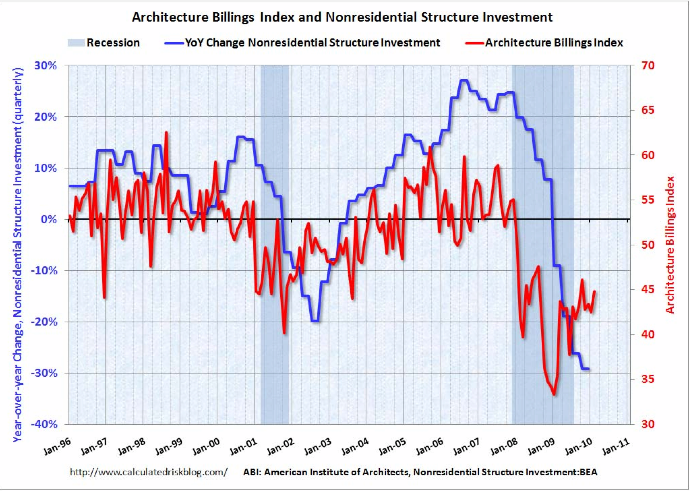
Those billings, if no longer in free-fall, are nevertheless still declining significantly, suggesting that commercial construction's collapse will continue through the end of this year.
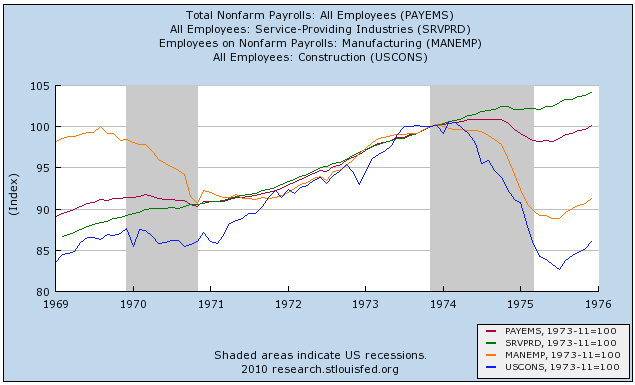
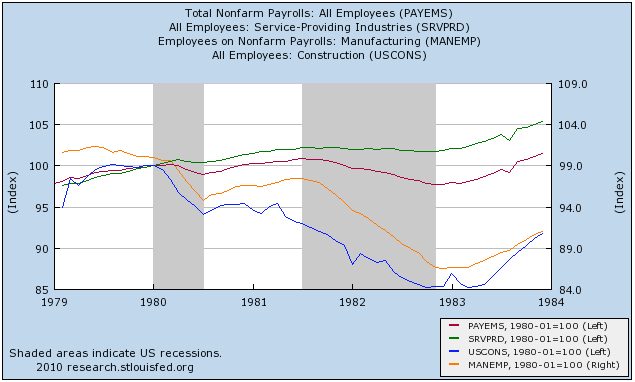
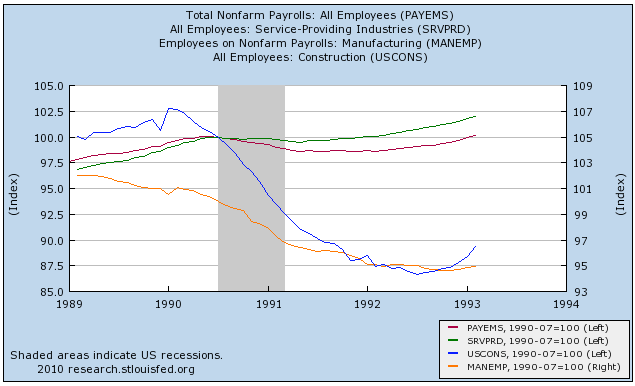
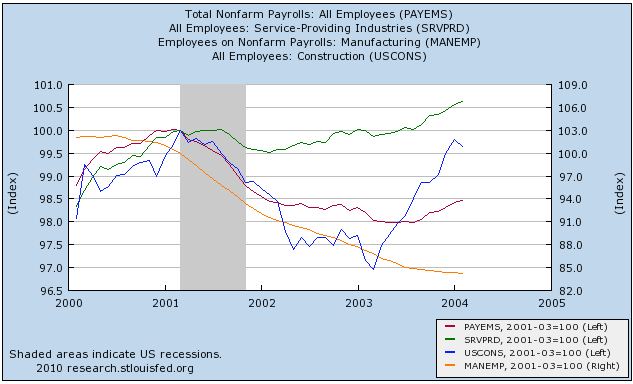
That construction continues to exert a tremendous drag on employment shows up in the following graphs, which break out the overall employment (dark red) into service jobs (green), manufacturing jobs (orange), and construction jobs (blue) (NOTE: Unfortunately there is no way to further break down construction employment into residential vs. nonresidential).
In the typical postwar recovery, construction and manufacturing jobs, as well as service jobs, picked up almost immediately after GDP increased:
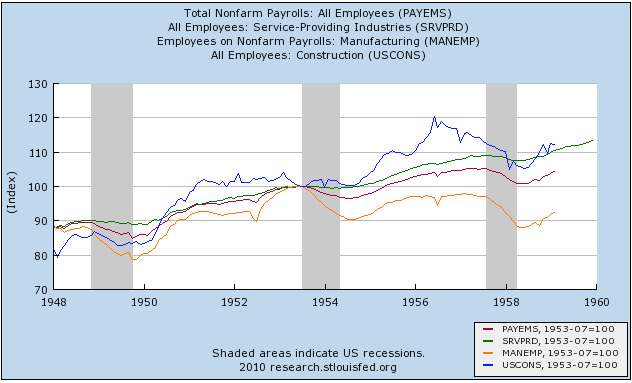


This pattern continued through the 1982 deep recession:

Then came the 1992 and 2002 "jobless recoveries." In both of these cases, it was manufacturing jobs even moreso than construction jobs which continued to be shed after GDP turned up. In 1992, construction jobs turned up at midyear, while manufacturing job losses continued for several more months:
In 2002, construction jobs stabilized before one last decline for several months in 2003, while manufacturing jobs continued to decline throughout the entire period:
Now, unlike every other recovery since the second world war, manufacturing has stabilized, even adding a few jobs in February, while construction continues to suffer steep declines:
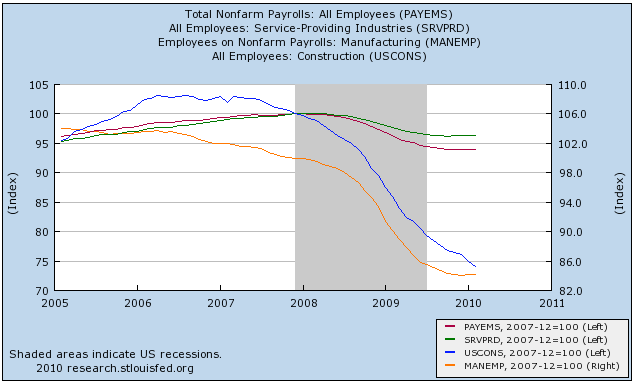
One out of every 4 construction jobs has been lost in the last 3 years, the most in any post-war recession. There is no indication yet of a turnaround. Since housing permits have increased, albeit anemically, in the last 10 months, it is likely that almost all the losses in construction jobs have been in commercial construction (something I imagine almost every reader can correlate with the half-empty commercial strips in their own town or city), as to which the above graph from Calculated Risk indicates the decline is going to continue for at least about another year.
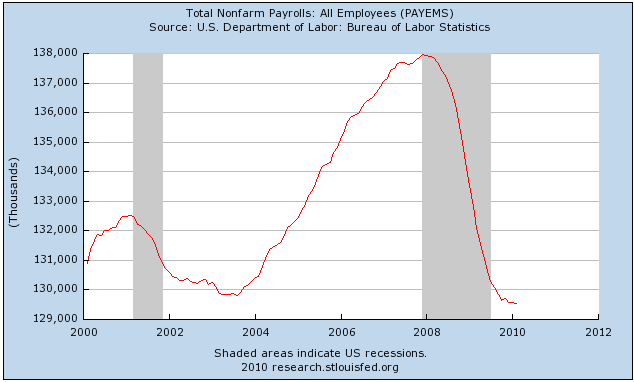
So, while it is likely that we will find out by the end of this week that we have turned the corner and are actually adding jobs in the economy, there will continue to be strong drag on growth from a pitiful construction sector for some time to come.

In 2002, construction jobs stabilized before one last decline for several months in 2003, while manufacturing jobs continued to decline throughout the entire period:

Now, unlike every other recovery since the second world war, manufacturing has stabilized, even adding a few jobs in February, while construction continues to suffer steep declines:

One out of every 4 construction jobs has been lost in the last 3 years, the most in any post-war recession. There is no indication yet of a turnaround. Since housing permits have increased, albeit anemically, in the last 10 months, it is likely that almost all the losses in construction jobs have been in commercial construction (something I imagine almost every reader can correlate with the half-empty commercial strips in their own town or city), as to which the above graph from Calculated Risk indicates the decline is going to continue for at least about another year.

So, while it is likely that we will find out by the end of this week that we have turned the corner and are actually adding jobs in the economy, there will continue to be strong drag on growth from a pitiful construction sector for some time to come.