The Great Recession, which rolled over our financial lives like one of P.J. Keating's giant pavers, is most likely over. Home sales, while still far below the levels of a year ago, have risen for three straight months—a first since 2004. The stock market has rallied 44 percent since March, thanks to renewed optimism and improving earnings from big companies like Goldman Sachs and Apple. In June, seven of the 10 indicators in the Conference Board Leading Economic Index pointed upward, including manufacturing hours worked and unemployment claims. Macroeconomic Advisers, the St. Louis–based consulting firm, says the economy is expanding at a 2.5 percent annual rate in the current quarter. Economic activity "will increase slightly over the remainder of 2009," Federal Reserve chairman Ben Bernanke told Congress.
From the conference board:
The Conference Board LEI for the U.S. increased for the third consecutive month in June. Most of the components contributed positively to the index this month except real money supply* and manufacturers' new orders for nondefense capital goods*. The six-month change in the index has risen to 2.0 percent (a 4.1 percent annual rate) in the period through June, up substantially from - 3.1 percent (a –6.2 percent annual rate) for the previous six months, and the strengths among the leading indicators have remained balanced with the weaknesses in recent months.
Let's highlight why these numbers are so important. There are three types of economic indicators -- leading, coincident and lagging. Leading indicators happen before anything happens. The amount of advance time can vary, but the important point to remember is they typically happen first. A three month rise in leading indicators is a strong economic development that indicates we have a strong prospects of growth in the next few quarters.
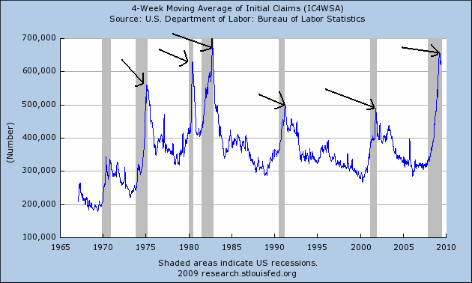
The 4-week moving average of jobless claims continues to drop:
This number has been decreasing for several months and has now moved below the 600,000, currently standing at 566,000. While the seasonally adjusted number increased 30,000 this week, the unadjusted number decreased by 90,298. There has been some debate in economic circles regarding statistical adjustments to the seasonally adjusted numbers that was caused by auto industry lay-offs. However, the drop of 90,298 in the unadjusted numbers gives a strong indication that traditional seasonal factors are in play.
The reason this is important is this indicator typically drops right at or just after the end of a recession.
Existing home sales increased last month by 3.6%. However, the best part of the news is a possible bottoming in the pace of existing home sales. Here's the chart:
Notice there are two relevant time periods. The first is from (roughly) October 2007 to September/October 2008. This period saw a strong level of sales consistency. Then sales dropped again, largely caused by the financial problems of last fall. However, sales appear to have hit a bottoming level from that event and are stabilizing. It's important to note this only deals with the pace of sales. There are still big issues in the housing market that indicates we'll probably have a two bottoms -- a bottom in sales and a bottom in prices -- and Prices are nowhere near bottom right now. But, there are increasing signs of hope.
There is even hope that new home sales have bottomed:
As I originally pointed out on Thursday all the major averages have broken through resistance and are moving higher.
This is important for several reasons.
1.) This is an indication that investors' risk appetite is returning. That bodes will for the future.
2.) Stock indexes are a leading economic indicator, indicating there is growing confidence in future earnings prospects.
Let's add a few more data points:
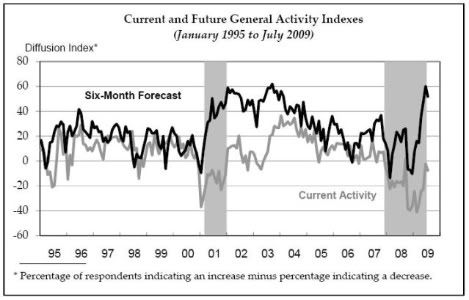
Although the Philly Fed index dropped a bit last month, its overall trend is moving higher.
The Empire State index is also showing signs of improvement.
The ISM manufacturing index has been increasing for the last 5 months.
Credit spreads have returned to more normal levels
Retail sales appear to have bottomed as have
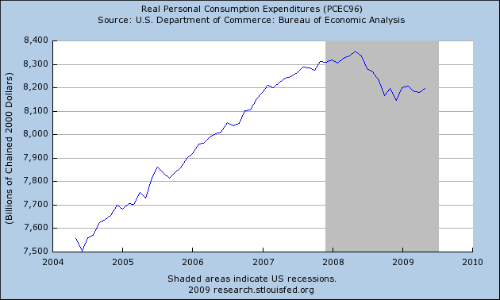
Real personal consumption expenditures and
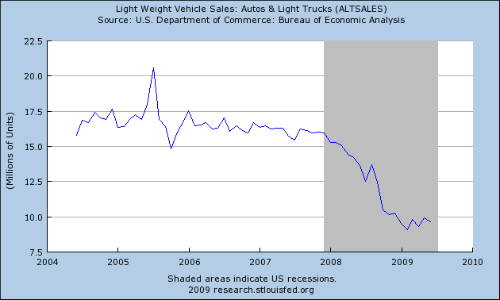
Auto sales
Simply put, there is a ton of information indicating the worst is over.