Let's start with a long-term view of the short end of the curve as represented by the SHYs. Notice this chart started to rally in mid-2007 -- right when we started to hear about financial problems. This part of the market continued to rally until early 2008 when it sold off only to rally again starting in mid-2008. Then it rallied until the end of last year when it started its current sell-off.
However, take a step back and simply notice that the last year and a half could be considered a standard reaction to extreme financial dislocation. That means the latest sell-off would be a return to normalcy.

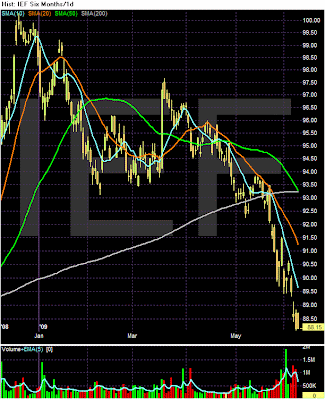
Notice that much of what was written about the SHYs also applies to the IEFs. And again, that means the recent sell-off could be seen as a return to normalcy -- that is, we're getting back to a normal yield curve with non-"the world is falling apart" interest rates.

On the daily IEF chart, we are clearly in a bear markets. Prices have fallen through th e20 0day SMA, all the SMAs are moving lower, the shorter SMAs are below the longer SMAs and prices are below all the SMAs. Also note the 10 and 20 day SMAs have moved through the 200 day SMA and the 50 day SMA is about to move through the SMA.