This will be a long post.
Employment continued to contract. Private nonfarm payrolls fell sharply in December, with substantial losses over a wide range of industries. Indicators of job vacancies and hiring declined further, and layoffs continued to mount. The unemployment rate increased to 7.2 percent in December, the share of individuals working part time for economic reasons surged, and the labor force participation rate edged down for a second consecutive month.

Above is a chart of the year over year percentage change in total payrolls. Notice the latest percent change is now lower than the 1990s and 2001 recession. We're in 1982 territory -- a particularly nasty recession. I wrote a longer article on the jobs market after the latest BLS report which has a longer list of data points.
In December, industrial production posted a sharp decline after falling substantially in November; the contraction was broad-based. The decrease in production of consumer goods reflected cutbacks in motor vehicle assemblies as well as in the output of consumer durable goods such as appliances, furniture, and carpeting. Output in high-tech sectors contracted in the fourth quarter, reflecting reduced production of semiconductors, communications equipment, and computers. The production of aircraft and parts recorded an increase in December after being held down in the autumn by a strike and by problems with some outsourced components. Available forward-looking indicators pointed to a further contraction in manufacturing output in coming months.

Capacity utilization -- the amount of our industrial capabilities that we use -- is near the lows of the 1982 recession. Also note it

Durable manufacturing is falling off a cliff as well. It's rate of decline is that of the mid-1970s contraction.

The rate of decline of non-durable manufacturing is also are mid-1970s levels.
Real consumer spending appeared to decline sharply again in the fourth quarter, likely reflecting the combined effects of decreases in house and equity prices, a weakening labor market, and tight credit conditions. Real spending on goods excluding motor vehicles was estimated to have fallen noticeably in December, more than reversing an increase in November. Outlays on motor vehicles edged down in November and December following a sharper decline in October. Early indicators of spending in January pointed to continued soft demand. Readings on consumer sentiment remained at very low levels by historical standards through the end of 2008 and showed little improvement in early January.

Real (inflation-adjusted) expenditures are near record lows for the year over year percentage change as well. This figure includes retail sales, which are also abysmal

Single-family housing starts dropped at a much faster rate in those months than they had in the first 10 months of the year. Multifamily starts also fell in those months, as did permit issuance for both categories. Housing demand remained very weak and, although the stock of unsold new single-family homes continued to move down in November, inventories of unsold homes remained elevated relative to the pace of sales. Sales of existing single-family homes dropped less than sales of new homes in November and turned up in December, but the relative strength in sales of existing homes appeared to be at least partly attributable to increases in foreclosure-related and other distressed sales. Although the interest rate on conforming 30-year fixed-rate mortgages declined markedly over the intermeeting period, the Senior Loan Officer Opinion Survey on Bank Lending Practices that was conducted in January indicated that banks had tightened lending standards on prime mortgage loans over the preceding three months. The market for nonconforming loans remained severely impaired. Several indexes indicated that house prices continued to decline rapidly.
The housing market is still a mess (thanks to Calculated Risk for the images)

The months of supply at the existing sales pace is still high. Again, the drop is probably temporary for the reasons cited above.

New home sales continue to drop -- there has been no attempt on the graph to slow the fall.

While the total inventory has been dropping (which is good)

The months of available inventory is still increasing because of the continual drop in sales.
As a result of all this:

Prices are still dropping. Note how far about the standard median of the 1990s prices still are. In other words, we probably have a long way to go.
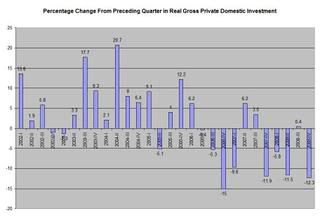
In the business sector, investment in equipment and software appeared to contract noticeably in the fourth quarter, with decreases registered in all major spending categories. In December, business purchases of autos and trucks moved down. Spending on high-tech capital goods appeared to decline in the fourth quarter. Orders and shipments for many types of equipment declined in October and November, and imports of capital goods dropped back in those months. Forward-looking indicators of investment in equipment and software pointed to likely further declines. Construction spending related to petroleum refining and power generation and distribution continued to increase briskly in the second half of 2008, responding to the surge in energy prices in the first half of that year, but real investment for many types of buildings stagnated or declined. Vacancy rates for office, retail, and industrial properties continued to move up in the fourth quarter, and the results of the January Senior Loan Officer Opinion Survey indicated that financing for new projects had become even more difficult to acquire.

Net investment has decreased in 8 o the last 11 quarters. In addition, note that investment barely increased in one of those quarters.
Here's the bottom line: it's terrible out there.