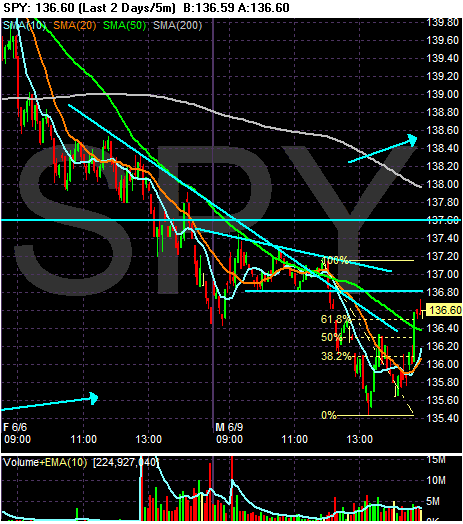
The SPYs moved sideways for most of the morning. However, the bar that printed at noon shows a strong move downward move, followed by a continued move downward with a heavy volume spike 15 minutes later. The market continued to move lower until about 1:45 when the market rebounded. The SPYs printed a double bottom and then broke through the 10 and 20 minute SMA to close right around the 61.8% Fibonacci level from the morning's sell-off.

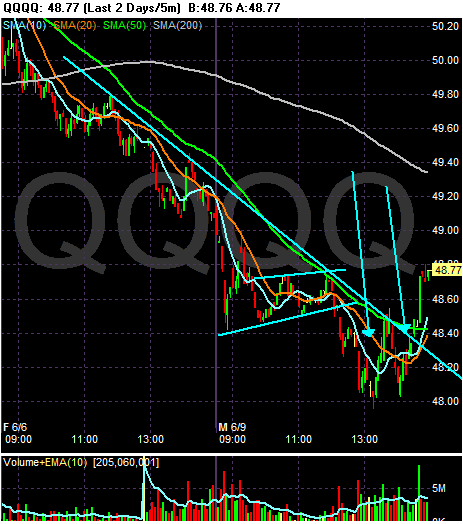
Notice the QQQQs continued their downward move started on Friday. The market opened lower then consolidated sideways. However, the 50 minute SMA provided resistance right around noon and the marker moved lower, eventually gapping down twice. The two arrows point out a double bottom, but the market printed a strong upward moving bar on strong volume 20 minutes before the close.

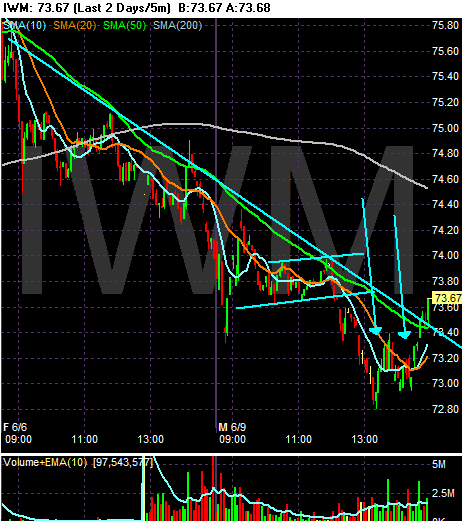
The IWMs dropped at the open, but moved sideways until they found resistance at the downward trend line started on Friday. The market moved lower until it formed a double bottom (pointed out by the two arrows). The market rallied at the end of the day, eventually closing above the resistance line started on Friday.