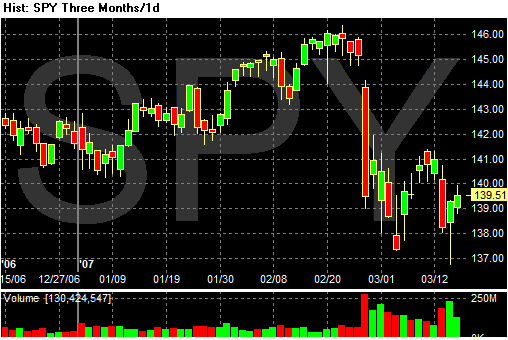
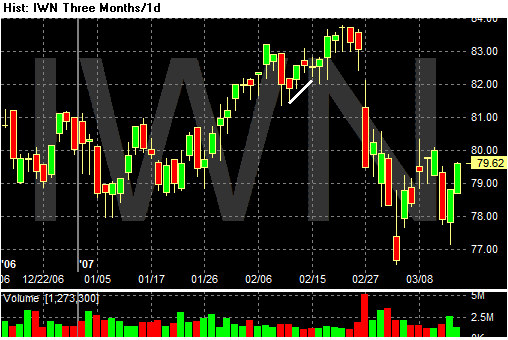
Here's the SPYs and IWNs


The most bullish interpretation of both these charts is they are forming a double bottom or triangge consolidation. A double bottom is a reversal pattern, meaning it occurs at tops or bottoms. If this is the case, then the market should rally from here If this is a triangle formation it can be either a reversal or continuation pattern (meaning a pattern that occurs in the middle of a trend). If that is the case we need the market to move decisively in one direction or another to confirm the trend.
Because there are multiple and conflicting technical interpretations of the current market fundamental considerations are more important than usual. Fundamentally we've had a ton of bad news over the last few weeks. Subprime mortgage problems abound; manufacturing is hovering between expansion and contraction and producer prices increased more than estimated which hems in the Fed. In other words, the fundamental backdrop clearly favors the bears.
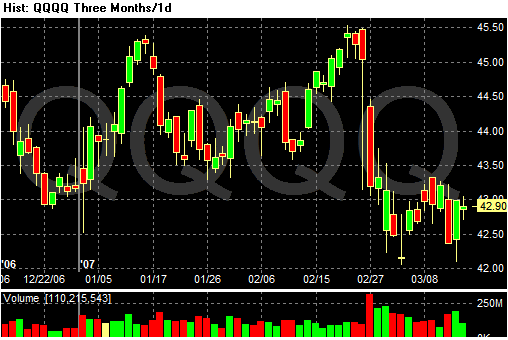
Here's a chart for the QQQQs:

This is what Gartley would call a "complex" formation, which means it's difficult to categorize conclusively. I think of these patterns as rectangle patterns, largely because you can draw a rectangle around it. There is the possibility of a double bottom and a triangle, but neither formation are very strong.
All of the previous fundamental analysis still applies.
Short version: we're still waiting for confirmation in either direction, but the fundamental picture is not promising.