- by New Deal democrat
It sure seems like somebody sent Paul Krugman a link to my post the other day about Why, despite the worst economy since the Great Depression, the stock market has made a new all-time high. Because he wrote a series of tweets that look like a direct reply.
So here is my response.
To recapitulate, on Monday I suggested that the answer to the conundrum primarily consisted of 3 reasons:
1. Background longer term fundamental factors [particularly all-time low interest rates] for the economy are very positive.
2. All other industrialized countries beside the US have controlled the pandemic [so global companies’ earnings will reflect that].
3. Market gains are completely bifurcated, and are essentially limited to the 6 biggest players [FAANG+Microsoft] in the global economy and in home delivery [so companies whose footprint is either digital or based on home deliveries especially benefit].
As an aside, although I specifically declaimed that my explanation had no “actionable information” for stock investors, Seeking Alpha picked it up anyway, and so far it has about 70 comments there. But back to the main point.
On Wednesday, Paul Krugman weighed in with a series of tweets:
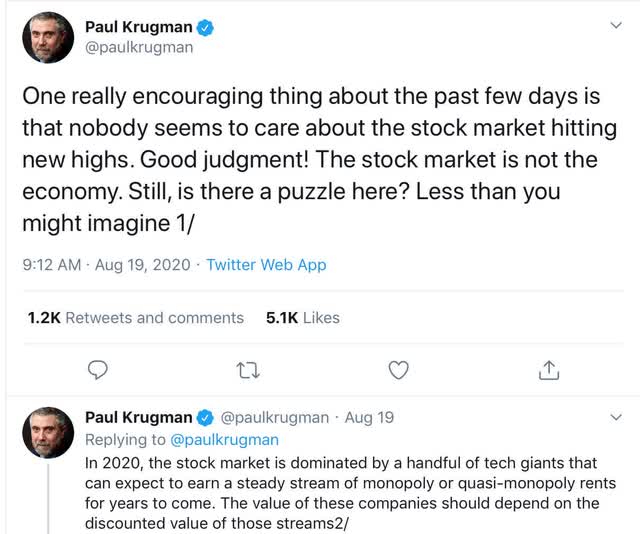
To rephrase his tweets in terms of my thesis:
1. Yes, but short term profits over the next year of so shouldn’t matter [because Paul Krugman is a macroeconomist who can’t help but think in terms of rationally discounted value out to an ad infinitum future]
2. Zzzzzz.
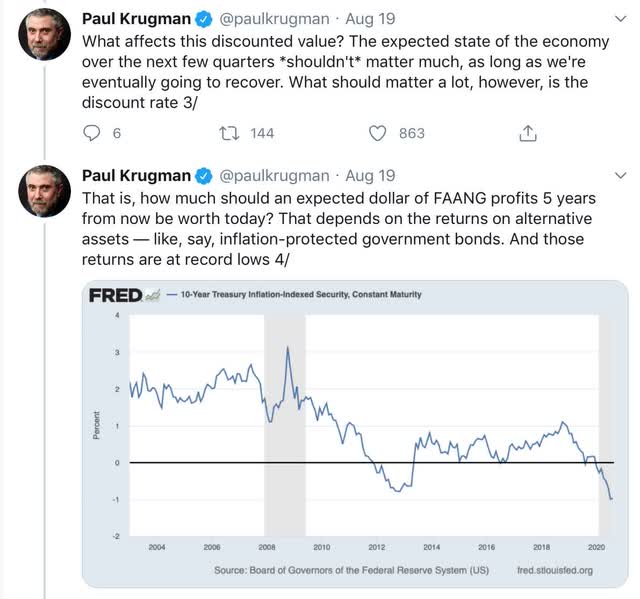
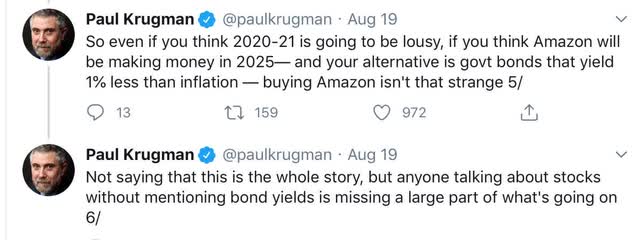
3. Yes, and beyond that, FAANG+Microsoft are able to charge monopoly rents for the foreseeable future.
4. BUT, since government bonds yield less than the foreseeable inflation rate, bidding up profitable companies is a rational investment decision. And further, “anyone talking about stocks without mentioning bond yields is missing a large part of what’s going on.”
Herewith, my response.
Corporate profits are a long leading indicator for the economy; stocks a shorter leading indicator. Unsurprisingly, over the long term corporate profits lead stock prices, not visa versa. Here’s a graph of that going back to 1987:
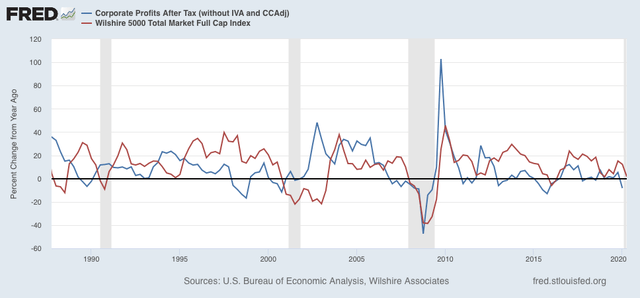
Note, importantly, that not only do stock prices, averaged quarterly, clearly follow corporate profits, but further that they do so with a 2-4 quarter lag —NOT 5 years! If the present situation holds true to form, second or at least third quarter corporate profits are going to bounce back smartly. In other words, actual, empirical history, going back decades, says that while “the expected state of the economy over the next few quarters shouldn’t matter much,” the expected state of corporate profits *should.*
But what about the negative “real” interest rate in Treasury bonds? There are two problems with Krugman’s formulation, one theoretical and one empirical.
The theoretical problem is his comparison of “Amazon making money in 2025” vs. “government bonds yielding less than inflation” now. See the problem? If we’re going to be consistent, it is the total government bond return over 5 years vs. Amazon’s total return over 5 years.
This wouldn’t be that much of an issue if the “super 6” paid dividends. If I could expect to earn 1% on a Treasury over 5 years, but 2% in dividends on my alternative basket of stocks, then stocks are clearly paying me more than bonds.
But among the Super 6, only Apple and Microsoft pay dividends. None of the other 4 - Facebook, Alphabet, Netflix, and Amazon - pay dividends at all! So any return is going to have to come in the form of capital appreciation. So, it *isn’t* simply a matter of whether, e.g., Amazon is going to still be profitable in 2025, but rather whether either (1) Amazon is going to continue to be *increasingly* profitable through 2025, thereby justifying an ever higher stock price, or (2) speculators will continue to bid up Amazon shares over the next 5 years even if its profits don’t increase (i.e., a bubble).
The second, empirical, problem with Krugman’s take is that, when we take a closer look, that isn’t how stocks have behaved.
Let me start by taking Krugman’s same graph of inflation indexed Treasuries (blue), and compare it with in-adjusted 10 year Treasuries (green), and broad market gains, measured YoY for easier comparison (red):
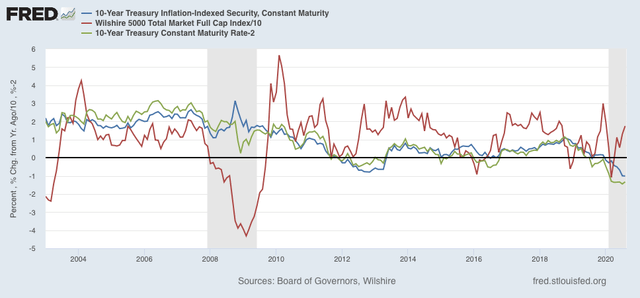
Note that, with the brief exception of November-December 2008, the two bond yields have moved pretty much in tandem, with less than a 1% variance. That’s because inflation ex-gas prices has averaged pretty close to 2% for the past 20 years, without a lot of variation.
Second, declining bond yields have indeed correlated with broadly rising stock prices - as I said in my first post, interest rates are the most important fundamental underlying the future economy. Krugman discounts this and instead focuses on an intermediate step, a variation on what is usually called the “Stock-bond yield gap,” I.e., how do stock dividends (in Krugman’s formulation, capital appreciation) compare with bond yields?
But now let’s look at the present episode of declining and negative real bond yields, below. First, here is the entire last 9 months since real bond yields made an intermediate high:
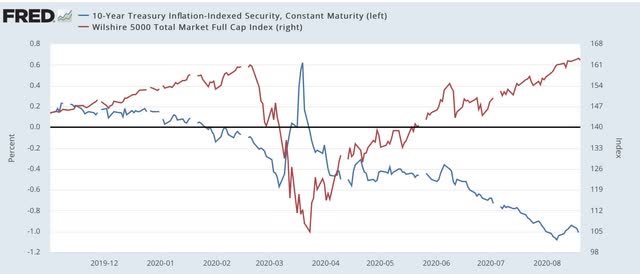
Note particularly in this context that the lion’s share of the stock market’s rebound - about 75% of it! — took place between the end of March and early June.
Next, here is the time period from November until the late March bottom:
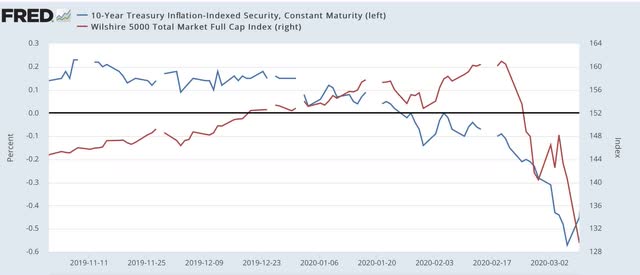
The first thing to note is that stocks *followed* bonds down in February and March. FAANG’s anticipated 5 year return didn’t seem to matter then, even though real bond yields went negative.
Now, here is the last 4+ months:
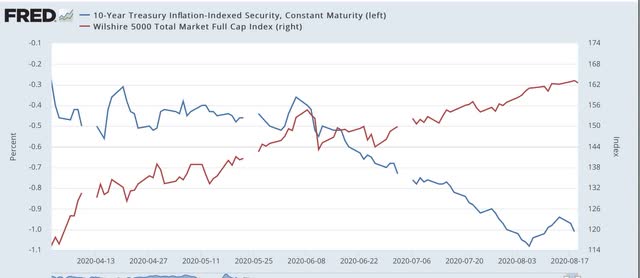
When we look on a micro, day-by-day basis, we see that stock prices and bond yields move generally in tandem. Increased bond yields, particularly the spike in early June, have correlated with positive moves in stock prices. Declining bond yields have correlated with lesser improvement in stock prices, or outright declines. This is the opposite of what we would expect if consistently profitable anticipated stock returns were being compared with bond yields by investors. Lower bond yields should lead to the most positive stock market days, and rising yields should correlated with market sell offs - but instead empirically the reverse has been true.
Further, going back to Krugman’s original graph, note that there was indeed a similar period of negative real interest rates in 2012-13. Let’s focus on that period, and again compare it with stock market returns, below:
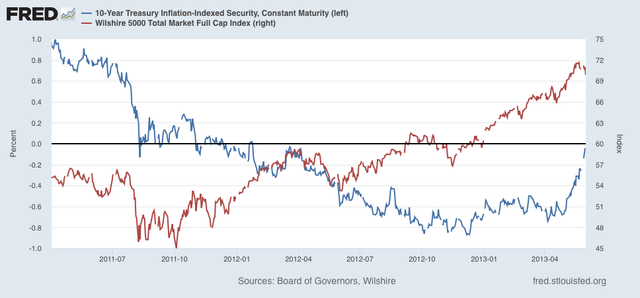
Just as with the past year, initially stock prices followed real yields down. Then, just like the past year, stock prices made their biggest move as real returns turned mildly negative, to about -0.2%. Despite real bond yields continuing to decline to about -0.9%, stock prices increased in a much less pronounced fashion - just as has been the case in the past 2 months, as I pointed out above.
In short, in both the 2012-13 time frame, and over the past 9 months, the biggest stock price gains were when the real return was barely negative, and not when real bond yields declined substantially further. This is not what should have been happening if the primary driver were consistently improving future corporate profits being compared with worsening forward expectations of real bond returns.
In conclusion, while I am sure that investors’ comparisons of anticipated future stock vs. bond returns plays some role in asset reallocation in favor of stocks, I do not think it is a major contributor to the new stock market highs.