- by New Deal democrat
Here is the update through yesterday (May 1).
As usual, significant developments are in italics. The trends in new infections, deaths, and in testing have all turned positive - if not positive enough. But the good news remains primarily a NY story.
I have discontinued giving the % increases day/day in infections and deaths. They were included when important to determine if the US was “bending the curve.” The issue now is whether any States (beyond the least populated rural or isolated States) can “crush the curve.”
Number of new and total reported Infections (from Johns Hopkins via arcgis.com and 91-divoc.com):
- Number: 34,129, total 1,104,161 (vs. day/day high of +36,161 on April 24)
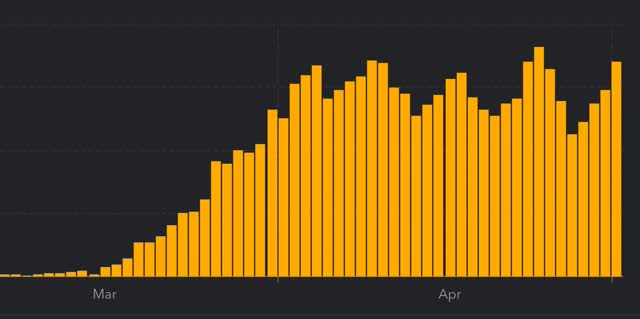
There has been a slight decrease in the number of new cases in the US. The US has the worst record in the world, by far, with no sign of any big decrease.
Number of deaths and infections and rate of increase of testing (from COVID Tracking Project)
- ***Number of deaths: 1,743, total 59,059 (vs. day/day peak of +2,700 April 29)
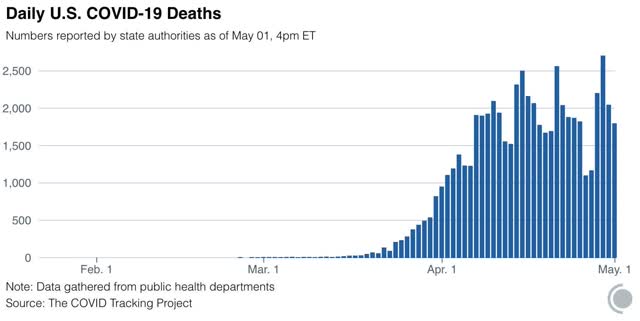
- Seven day average of deaths:1,896 (vs. 2,058 peak on April 21)
- Number of tests: 305,118 (new daily peak*)
- Ratio of positive tests to total: 9.1:1 (new high)
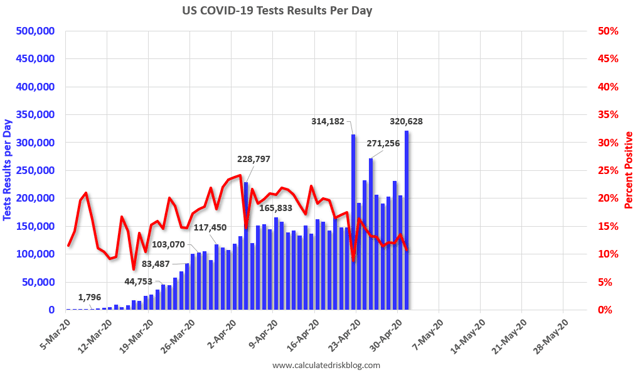
In the past three weeks, as shown in the graph above, the percentage of positive to total tests has declined from about 20% to 11%. If this percentage were to fall to 6%, then based on the history of South Korea, lockdowns can begin to be judiciously lifted and a thoroughgoing regimen of “test, trace, and isolate” can be begun. Four small States are in that range now (but none have the tracing or isolation regimen in place).
*ex.-Calif clearing its backlog
Comparison of deaths, infections, and testing for NY vs. US ex-NY:
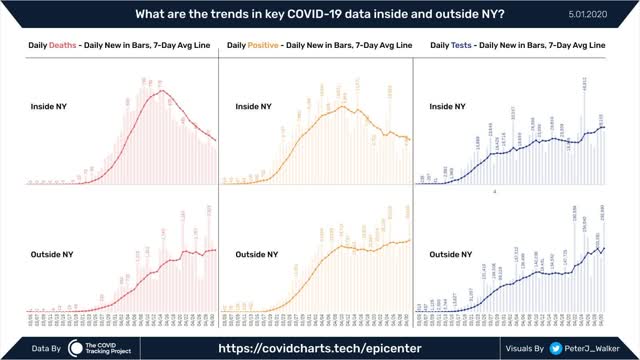
The good news about infections and deaths above is mainly about NY.
Summary for May 2
- The number of daily new infections, adjusted for testing, appears to have peaked two to three weeks ago.
- The number of daily new deaths also appears to have peaked about 10 days ago.
- The trend number of daily tests has improved dramatically in the past 9 days from an average of about 150,000-160,000 to about 230,000. Better still, for the last 4 days, new infections have declined, even with higher testing - a very positive sign.
- My personal suspicion remains that the actual number of total infections in the US is about 5x the official number, or roughly 5.5 million at present.
- Going forward, it will probably be important to separate out those States which are “opening up” without sufficient testing or precautions, which I expect to see a new wave of infections, vs. States which want to drive the number of new infections close enough to zero to follow an intensive “test, trace, and isolate” approach. I further expect that, once new infections begin to go hyperbolic again in those States which have “opened up,” they will go to lockdowns again.