- by New Deal democrat
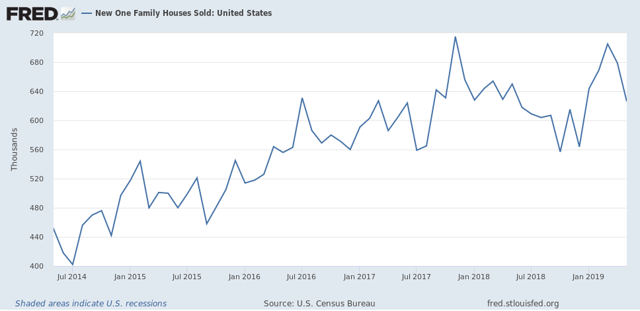
So, new single family home sales for May were reported light this morning:

Because this series is very volatile and heavily revised, as always take this with a grain of salt.


To smooth out some of the volatility, I pay more attention to the three month moving average, which at 670k is slightly below that of that average for the past two reports, and also slightly below the late 2017 peak. Still it is above all of 2018, so it nevertheless adds to the evidence that the bottom for housing is in.
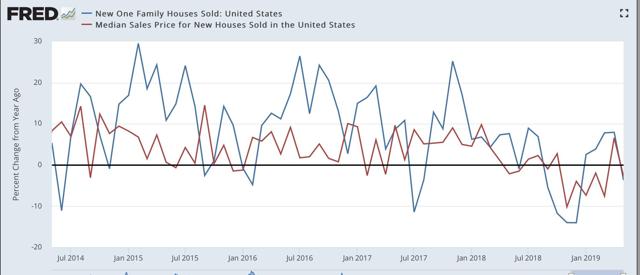
Also, the YoY% change in median price, while reverting to negative this month, is also a significant improvement over the situation over the winter (red in the graph below):

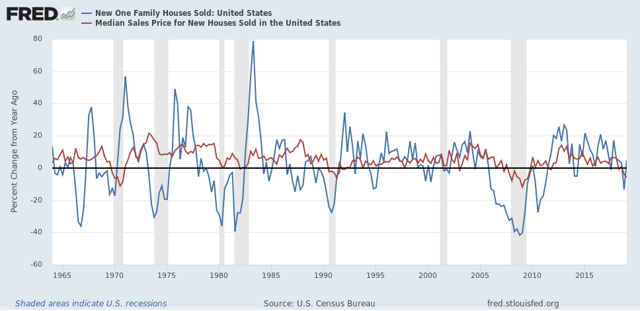
What is interesting here is how quickly price declines, and now price rebounds, have followed sales. Usually there is more of a lag:

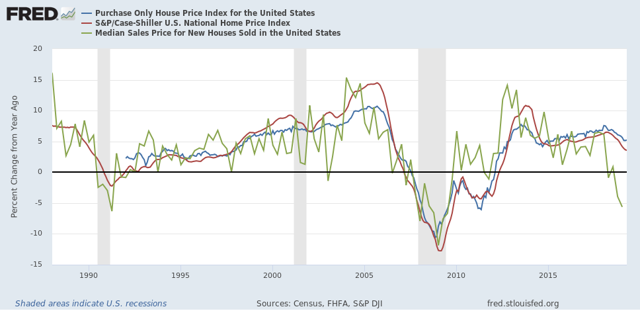
Here’s the quarterly average of YoY% change in median single family home prices (green, through Q1) vs. the monthly FHFA average (blue) and Case-Shiller national index (red):

The FHFA and Case-Shiller price indexes have only decelerated to a point where they roughly match median household income growth. This makes me wonder if prices for new homes will shoot back up again quickly as demand returns. If so, we could wind up in a “choke collar” situation (similar to what we had with gas prices 5 to 10 years ago), where rapid price increases choke off demand, which causes prices to back off, which reignites demand, and so on repeatedly.
This is important, because if the producer side of the economy falters, a choking off of higher new demand for housing would enhance the chances of a recession, and mute the chances of a housing recovery heading that off.