- by New Deal democrat
This is something of a work in progress.
Many people rely on the bond yield curve as a premier leading indicator. In fact, every recession since the 1950s has been preceded by an inverted yield curve, where long term rates are lower than short term rates. In fact, going back nearly 100 years, every time the yield curve has inverted with one exception, a recession has ensued. One problem that I discovered with this indicator, however, is that a deep recession can still occur in the presence of a normally sloped curve when there is deflation -- 1938 for example.
In fact, ECRI has stated that the yield curve is not one of their long leading indicators. Rather, they make use of the spread between corporate and government bonds.
Yet a third way of evaluating bond prices is to compare the yields on longer term bonds with the inflation rate. When bonds yield less than the inflation rate, it is thought, a recession is imminent. When I investigated this as well, I found that while it worked well since the 1950s, it would have falsely indicated economic contraction all through the 1933-37 New Deal recovery of 10% annual GDP growth, and all through the 1940s and early 1950s as well!
In general, based on the above it can be stated that bond interest rates are positive for the economy (1) the wider the positive spread between short and long term rates, (2) to the extent to which money can be borrowed cheaply vis-a-vis inflation, and (3) to the extent that corporate bonds are deemed relatively safe compared with treauries. The opposite conveys a negative indictor for the economy going forward. But no one of the three measures captures the full information. Recently several scholars looked into the matter, and found that taking all three measures into account -- I.e., the shape of the yield curve, bond rates vs. inflation, and corporate vs. government debt yield -- did yield an effective indicator. Unfortunately, their discussion did not include an academic-economics-to-English translation.
But while I can't translate their results into one handy graph, we can look at the separate components and see if we can arrive at a reasonable conclusion about whether they signal a recession or expansion.
First of all, let's take at the yield curve (I'm using the yield on 10 year treasuries - 6 month treasuries) since 1980:
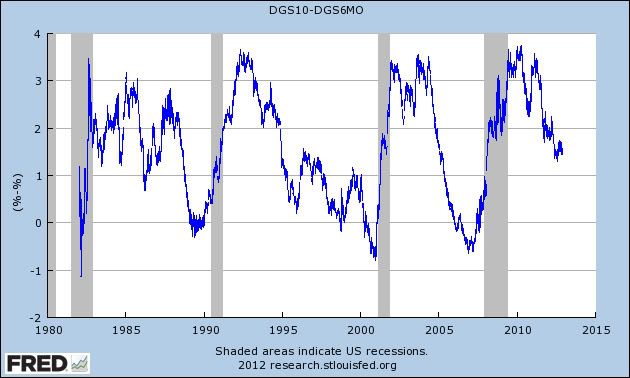
As indicated above, each and every recession since then has been preceded by an inverted yield curve. One problem, however, is that the yield curve normalized early in 2007, more than 2 years before the end of the Great Recession, and indeed over a year before the economy fell off a cliff in September 2008. It has had a normal shape ever since, and although it is less steep than a year or two ago, it is still well within the range of what has generally been considered consistent with expansion.
Next, let's look at the difference in interest rates between corporate bonds and treasuries. Here I am using BAA corporate bonds and comparing their yields with that of 10 year treasuries (blue) and 1 year treasuries (red):
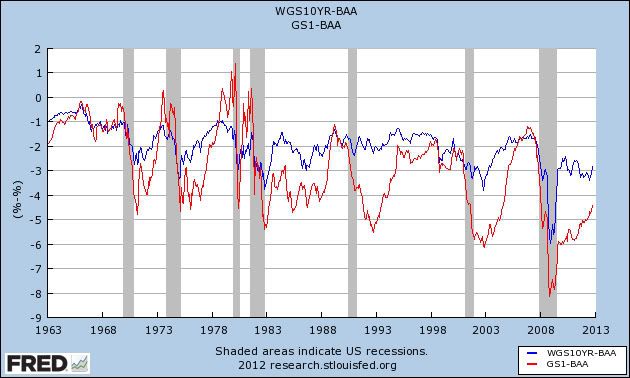
You can see that the spread becomes considerably more negative as we approach and enter a recession, particularly with compared with 10 year treasuries. Sometimes the spread with one year treasuries is much more pronounced on the cusp of a recession. Neither one appears to be signalling any downturn now.
Finally, let's take a look at 10 year treasury yields as compared to the inflation rate:
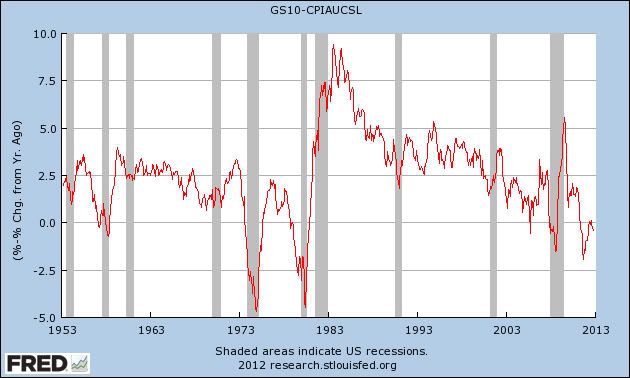
While it's clear from this graph that yields relative to inflation plunge as we enter a recession, the absolute level of yield is clearly irrelevant. We had a major expansion in the 1980s while yields exceeded inflation by 10%, and we had no recession in 2006 when yields were under the inflation rate. At the same time, there were several occasions in the 1950s and 1970s when there was a 2 year or greater lead time between the decline in the comparison and the onset of recession. We did have just such a precipitous decline in 2010 through early 2011.
One corrective is to measure the YoY change in this relationship, which I've done below:
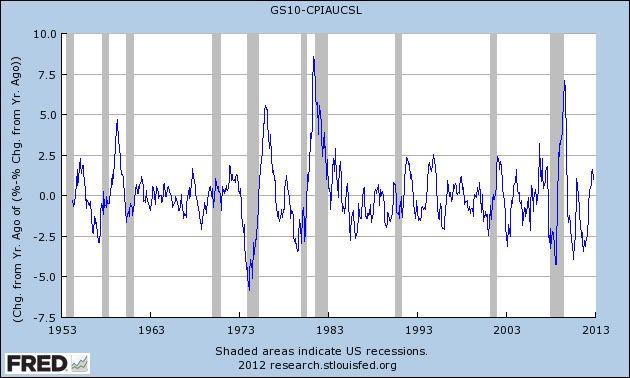
This graph is extremely noisy, but it does suggest that a decline significantly into negative values shortly before a recession almost always occurs. Presently treasuries are increasing their yields vs. inflation, as compared with a year ago.
I will be putting more work into this, to see if there is an algorithm or simple relationship that will enable us to put all three relationships into one indicator. For now, it is safe to say that neither the shape of the yield curve, nor the spreads between corporate bonds and treasuries is suggesting economic contraction. Only the relationship between bond yields and the inflation rate is consistent with trouble.