Several data series used in economic indicators may have special issues rendering thier signals misleading. Two important ones are both components of ECRI's Weekly Leading Index.
The first is purchase mortgage applications. Yesterday I wrote that the WLI would probably be more positive if ECRI were continuing to include its original real estate measure, the FRB's weekly H8 report. Beyond that, however, purchase mortgage applications, which have been flat to slightly declining for almost the last two years, are in stark contrast to housing permits and starts, which are at or near 3 year highs. For example, housing permits are 200,000 higher than their low point in early 2009.
The difference appears to be explained by the large number of all-cash sales, which ran at 33% in February. Purchase mortgage applications obviously don't pick up these cash sales. And it's housing itself, not mortgages, with which we are mainly concerned when we think of leading indicators. New houses have multiplier effects in construction, landscaping, appliances, tools, and maintenance which play out over several years. If there is an unusually large percent of cash sales, the multiplier effects from those are being completely missed by the WLI.
The other element of the index which may be giving a false signal, at least as far as the US economy is concerned, is the JoC ECRI industrial commodities index. This index plummeted beginning last April. It bottomed in December and has risen modestly since:
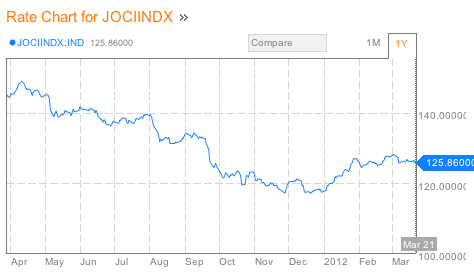
The question here is, is the index really measuring strength and weakness in the US economy, or is it actually a better barometer of the global economy? After all, prices, supply and demand for industrial commodities is set globally, not locally.
Ironically, the best evidence indicating that the JoC ECRI index is predicting an international rather than a US slowdown comes from ECRI itself, via its presentation on "Yo Yo economies" published last Friday, in which they opined:
The rising export dependence of these [suppliers of suppliers] economies, with growing involvement in global supply networks, makes it increasingly difficult for economies to decouple, especially for suppliers of early-stage goods that have embedded themselves further up the supply chain and farther away from the final consumer. This makes them highly vulnerable to the Bullwhip Effect and at the mercy of cyclical fluctuations in end-user demand growth.[my emphasis]
First of all, the JoC ECRI index was developed 30 years ago when the US was the dominant factor in commodity usage. If the world has become much more intertwined, i.e., the market for commodities is global, and if supplier economies such as China are the largest purchasers of raw commodities, then it follows that the index is probably primarily measuring strength or weakness in these supplier economies, not in the downstream consumer economies.
Further, it is necessarily true that if supplier economies are especially vulnerable to cyclical fluctuations, then economies which are primarily consumers of end stage goods, like the US, are the least vulnerable. If supplier economies are especially unable to decouple, then it followers that consumer economies are the most likely to be able to approach decoupling.
ECRI makes this point more explicitly elsewhere in their presentation:
[D]eveloping economies are very much subject to the Bullwhip Effect, where small fluctuations in consumer demand growth get amplified up the supply chain into big swings in demand as we move away from the consumer. So, smaller shifts in end consumer demand growth translate into larger fluctuations in intermediate goods demand, and even bigger ones in input material demand, and especially, raw material prices.In other words, an absolute contraction in supplier countries can be caused by simply continued growth, but at a slower rate, in a consumer country. Which means that converse is also true: an observed contraction in supplier economies (like China) does not necessarily mean that there is a contraction in consumer economies (like the US). Rather, consumer economies may simply continue to grow, just at a slower pace.
Even a modest decline in consumer spending growth in developed economies like the U.S. and Europe can help trigger a significant downdraft in the level of demand from suppliers and, in turn, a serious downturn in the level of demand for “suppliers to suppliers.”
As if that weren't clear enough, ECRI supplies this very helpful graph:
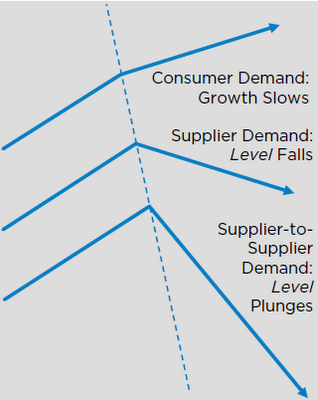
Unless I'm missing something, that arrow at the top for consumer countries in ECRI's diagram is still pointing UP.
So ECRI's own presentation suggests that their own indicator, the JoC ECRI commodities index, forecast a global downturn via its downdraft in the second part of 2011. But just as a recession in the US doesn't necesssarily mean a contraction in, say, Texas, so the global downturn measured by the commodities index may only have forecast slower growth in the US consumer economy.
ECRI's own presentation indicates as much. Oops!