Consider two different scenarios by which house prices could still decline 25% in real, inflation-adjusted terms, from the present:
(1) nominal prices decline 5% a year for 5 years, and inflation is 0% over that time.
(2) nominal prices do not decline at all over the next 5 years, but inflation is 5% a year.
Both of those give us "real" price declines of 25%, but with very different results, and very different amounts of pain.
In the first scenario, more and more homeowners are "underwater" with houses not worth what they paid for them, and not even worth the outstanding mortgage amount. They are unable to sell, since they can't bring cash with them to the closing table to make up the difference. More and more allow their houses to slide into foreclosure, thus increasing the shadow inventory of bank-owned houses.
In the second scenario, however, no more homeowners whatsoever are "underwater." Even better, mortgage payments - and purchases - are made with inflated currency. There is no further incentive to hand in the keys and walk away from the house, and shadow inventory is worked off.
Needless to say, the second scenario is a lot less painful than the first one and yet accomplishes the same result.
Over the last several weeks, I've read more and more commentary suggesting that at least nominal prices in the housing market might start to make a bottom. Now that we have the most recent Case-Shiller report (from April, but really a February, March, and April average), and the final June asking price data from Housing Tracker, which accurately showed the turn at the top of the market in 2006, let's take a look at whether housing prices may better fit the first or second scenario.
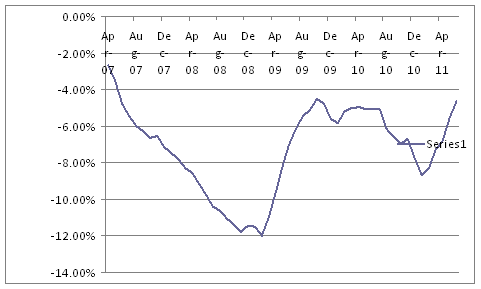
Here is the updated chart of YoY% change in asking prices from Housing Tracker's 1,000,000+ home database:
| Month | 2007 | 2008 | 2009 | 2010 | 2011 |
|---|---|---|---|---|---|
| January | --- | -7.5% | -11.5% | -5.8% | -8.7% |
| February | --- | -7.8% | -12.0% | -5.2% | -8.4% |
| March | --- | -8.3% | -10.9% | -5.0% | -7.3% |
| April | -2.7% | -8.6% | -9.6% | -5.0% | -6.8% |
| May | -3.5% | -9.1% | -8.1% | -5.0% | -5.6% |
| June | -5.0% | -9.8% | -7.0% | -5.0% | -4.4% |
| July | -5.4% | -10.4% | -6.1% | -5.1% | --- |
| August | -6.0% | -10.6% | -5.5% | -6.1% | --- |
| September | -6.2% | -11.1% | -5.1% | -6.6% | --- |
| October | -6.7% | -11.4% | -4.5% | -7.0% | --- |
| November | -6.6% | -11.7% | -4.5% | -6.7% | --- |
| December | -7.2% | -11.4% | -5.6% | -7.8% | --- |
The YoY -4.4% decline in June is the smallest YoY decline since May 2007. Here is the same information (through 2 weeks ago) shown graphically (h/t Silver Oz):

In comparison, here is the YoY% change up through the February - April average in the Case-Shiller 20 city index:

Over the time period of comparison, the Housing Tracker trend in asking prices has appeared to run 1 to 4 months ahead of the Case-Shiller sales data. Keep in mind that the most recent Case-Shiller data compares sales from a period when buyers and sellers wanted to close quickly to take advantage of the $8000 housing credit, with a period one year later where there is no credit. Even so, it looks like the YoY% change may be close to bottoming.
I fully expect the Case-Shiller series to bottom out in YoY% terms within the next several months, and to mirror the more current better YoY comparisons in the Housing Tracker database. In other words, it continues to look like the second scenario set forth above is going to be closer to the truth, and among the possibilities, that's good news.