The blowout upside report and revisions for retail sales, and the somnolent inflation report, show that real (inflation adjusted) retail sales have grown at a rate of over 6% a year for the last three months. Indeed, real retail sales have exceeded 6% YoY growth for almost half of this year. That bodes very well for employment going forward.
Because we have a large number of new readers, courtesy of Citizen K at DK, Jeff Miller at A Dash of Insight, and Seeking Alpha, I am taking this opportunity to explain again why I believe real retail sales are the "holy grail" leading indicator for job growth.
It is certainly true that any number of economic series have a correlation with payroll gains and losses. But none of them -- not GDP, not personal consumption, not person income, nor others -- over the long term tracks so closely with payroll growth. For example, in the past I have looked at GDP and compared it with payroll growth, noting that YoY percentage changes in GDP (minus two percent) appears to lead payroll growth:
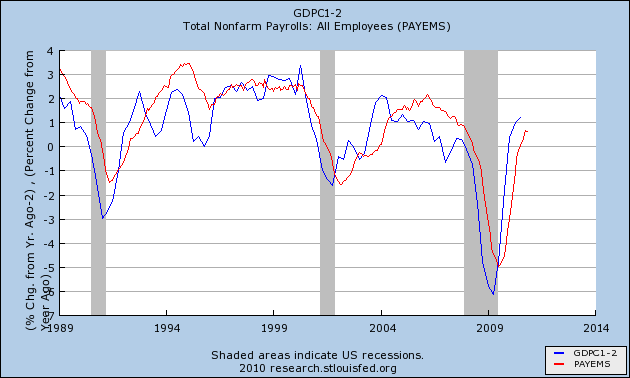
The problem is that GDP is only reported quarterly, so by the time you learn the GDP for a quarter (like Q4 2010), you already know what the payroll growth was. At best, YoY GDP when initially reported, can give guidance about payroll growth over the next couple of months.
To the contrary, not only do real retail sales correlate closely with payrolls over the long term, but they consistently lead the job market.
Contrary to the commonly held belief, historically it has not been the case that job growth leads to consumption. Rather, it is the other way around. Consumer spending typically leads jobs with a lag of about 5 months. Here is a graph showing that point as an average of all post-World War 2 recessions (0 = the month a recession ends):
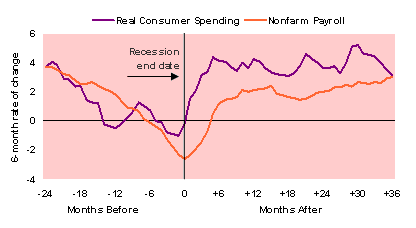
In fact, real retail sales have consistently turned at both tops and bottoms, an average of 3-5 months before job growth or losses turned with considerable variance (since WW2, the actual lead has been -4, -3, 0, +1, +4, +5, +5, +11, +14, +16, and +17 at tops, and -2, 0, +2, +3, +4, +6, +6, +7, +9, and +23 at troughs). This time real retail sales bottomed in April 2009, 8 months before jobs bottomed, longer than usual but well within its normal range as described above, and not nearly with so much a lag as in the 2002-03 "jobless recovery."
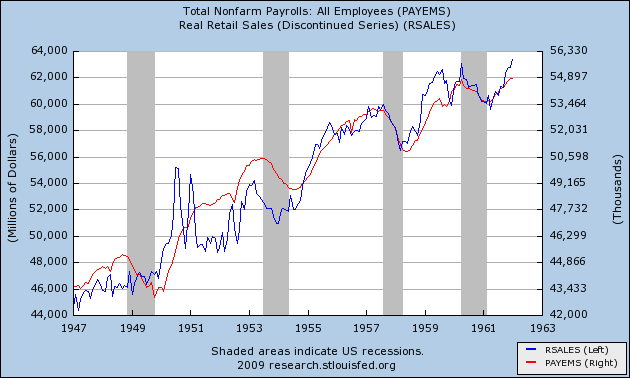
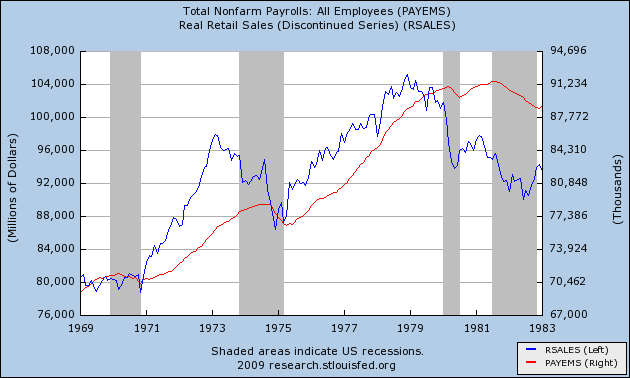
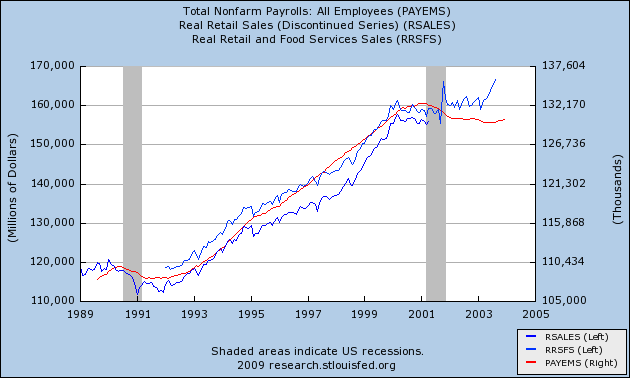
In order to show you this relationship in the most comprehensive way, I am reproducing here graphs showing the entire 60 year record of real retail sales compared with jobs. With the sole exception of the 1961 recession, Real retail sales (the blue line) has consistently made peaks and troughs ahead of payrolls (the red line) ...
in the postwar period from 1948 through the 1962:
as it did during the 1970s recessions (ex the 1970 trough):
as it did during the 1991 and 2001 recessions and "jobless recoveries":
as it has just done with regard to the "Great Recession:"
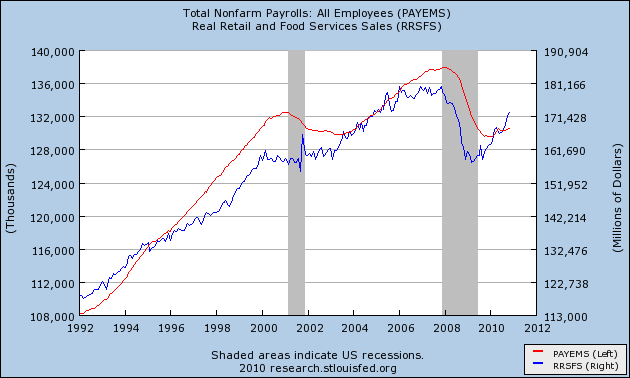
Not only do real retail sales have an excellent track record leading turning points for job growth and contractions, but they also have a very strong relationship to the rate of those jobs added or lost. Thus, the above graph, based on a relationship that goes back over 60 years, strongly suggests that job growth is going to turn stronger, and very soon.
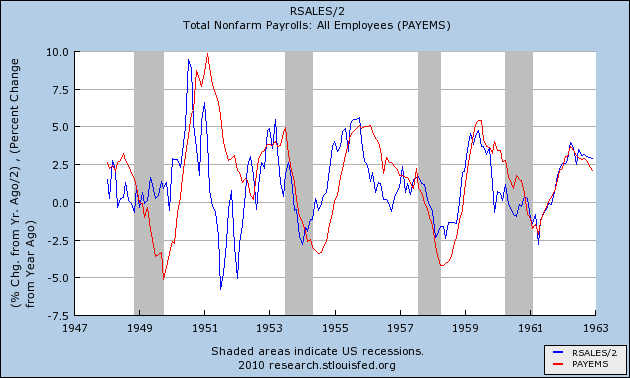
To see this, let's examine the year-over-year percentage changes in each. That is what the next series of graphs show. Because real retail sales are historically much more volatile, these graphs take the YoY percentage change in real retail sales and divide by 2 (blue line), which historically yields a very close fit with YoY payroll changes (red line).
Here it is for the immediate postwar period:
And here it is for the 1970s recessions and recoveries:
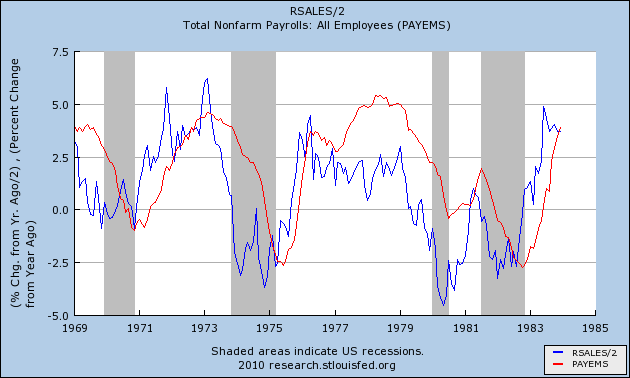

And here it is for the two "jobless recoveries" and up until now:
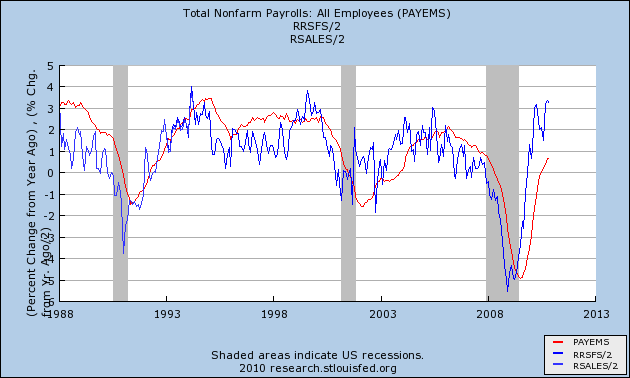
Notice that real retail sales not only lead, but that the amplitude of the changes is usually very similar.
In fact, the weakest relationship by far occurred during the lame "Bush expansion." Real retail sales only went up more than 5% YoY (translating to 2.5% on our graph) for 4 months during that entire time: February and March 2004 and June and July 2006. It took 12 months thereafter for YoY job growth to peak at 1.7%. If our recovery were as weak as the Bush expansion, that would still mean 2 million jobs added in a year by spring 2011, or an average of 165,000+ jobs a month.
Real retail sales have been up over 6% YoY now for 5 of the last 10 months. We were here once before, in April, before a nearly simultaneous confluence of bad events - the BP oil disaster, the Euro crisis, Oil at $90, and the expiration of the $8000 housing credit - knocked us into the summer slowdown, when both consumers and employers temporarily "froze" as they worried about a repeat of the 2008 financial panic. If we can avoid a similar series of setbacks, I am confident that at some point within the next 12 months, payroll growth is going to approach the growth in real retail sales, just as it has for over 60 years. And that means some pretty strong job growth in the upcoming months.