David Altig of the Atlanta Fed, who also blogs at Macroblog, wrote a long note describing "The Growing Case for a Jobless Recovery". It's only fair that I write about a take contrary to my own, and add some further comments:
First, he notes that the Wall Street Journal reports that
"Companies across the economy are holding off on hiring even as the profit outlook improves, amid economic uncertainty and their own success at raising productivity in rough waters.... Hiring always lags behind in economic recoveries, but the outlook this time is worse, many economists say. Most forecasters now expect a prolonged period of high unemployment ...."He next notes that Job opportunities are scarce, relying on the Job Opportunities and Labor Turnover Survey, a/k/a "JOLTS", to the effect that
"At the end of August there were estimated to be fewer than 2.4 million job openings, equal to only 1.8 percent of the total filled and unfilled positions—a new record low."Additionally, Job losses have been disproportionately concentrated in small businesses :
"[B]usinesses with fewer than 50 employees account for about one third of net employment gains in expansions. They have accounted for about 45 percent of job losses since the beginning of this recession. Given that these are the types of businesses most likely to be dependent on bank lending—and given that bank lending does not appear poised for a rapid return to being robust—the prognosis for an employment recovery in these businesses is a question mark."Next, he notes the large number of people who are Involuntarily working part-time , which,
"at 8.8 million, [is] well above the level of past contractions in both absolute and relative terms..... One potential implication of this fact is that firms probably have the capacity to expand production without hiring new workers (or increasing worker productivity). All these firms have to do is give more hours to existing workers...."Finally,
"the percentage of employee separations labeled permanent is at a recorded high..... [T]hose who have been permanently separated from your previous employer, who has no expectation of hiring [them] back..... The last category is the dominant reason for unemployment at this time. That might not seem surprising, but it actually is. Never, in the six recessions preceding the latest one, did permanent separations account for more than 45 percent of the unemployed. The current percentage stands at 56 percent as of September and appears to be still climbing."Concludes Altig:
"none of this is proof positive that we are in for a "jobless recovery," but, to me, the odds appear to be increasing."While I certainly respect the credentials and the perspicacious analysis of Mr. Altig, as he says, it isn't proof positive, and there are some limitations in his argument that cause me to find it less than convincing. In the first place, two of the data series he relies on are less than 20 years old. The small business hiring data only goes back to 1992, and the JOLTS survey only goes back a decade! Saying that one of these series is "at a record" is not the same thing the same statement made for a data series with 50 or 100 years of data behind it. Additionally, the JOLTS data didn't turn more positive until summer 2003 after the last recession, clearly showing that it is a lagging indicator. Most likely the jobs turn will have already happened by the time it shows up in the JOLTS data.
As to the effect of lack of bank lending, one of the first commenters at Altig's blog countered with The National Federation of Independent Business's October 2009 survey of small business people in which very few complained about lack of credit -- it was lack of customers that worried them! I should further point out that bank loans too are a lagging indicator. Historically, lending is always lousy at the beginning of recoveries, and only begins to turn around once the recovery is clearly underway.
While Altig's point about the huge number of people being involuntarily part-time employed makes intuitive sense, it too runs afoul of the data from past recoveries. Traditionally the deeper the initial downturn in the "V" of recession, the stronger the upturn coming out -- and that includes hours worked, as I showed back in July.
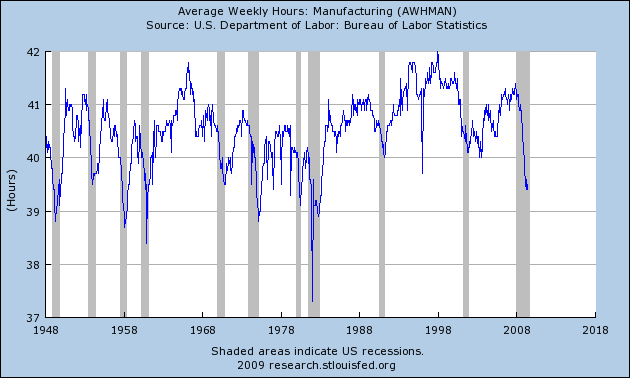
What I suspect Altig is truly picking up is a byproduct of the fact that this Recession hit service business and employment far harder than any previous recession. Typically right up to and including the 2001 recession, the brunt of layoffs was borne in manufacturing and construction, while retail and other service businesses were relatively untouched. Layoffs in goods producing industries were 85% or more of the total -- until this Recession, as shown on this graph:
in which , as shown on this chart:
Here's a chart, showing HOW, contrary to earlier recessions, fully half of the 8 million jobs lost in this Recession have come from service businesses:
| Month | Mfg # lost | Services # lost |
|---|---|---|
| 1979-82* | 3.6M | 0.3M |
| 1990-91 | 2.1M | 0.4M |
| 2001-03 | 3.0M | 0.5M |
| 12/2007-8/2008 | 0.6M | 0.4M |
| 8/2008-9/2009 | 2.9M | 3.2M ! |
[*Services measured from 10/80 peak. M = million]
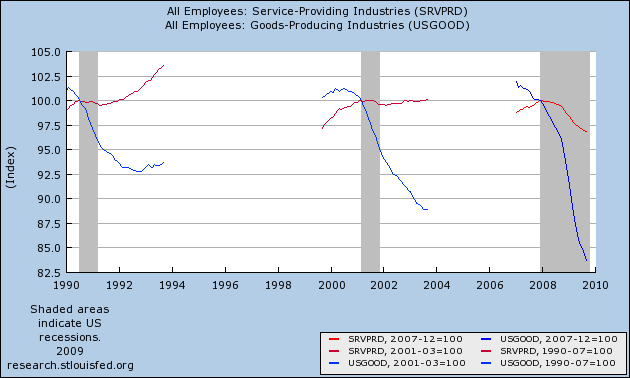
Service businesses, I suspect, are disproportionately small businesses, and because their owners have no experience even remotely comparable to the present, undoubtedly they and their former employees view their layoffs as permanent. Again, a graph I have previously shown demonstrates that in the 1991 and 2001 recessions, service jobs were lost later and gained back earlier -- turning positive before the end of the recession. In this Recession, as shown on the graph below, courtesy of Raymond James, service layoffs have been endemic -- and they were a surprisingly awful -147,000 of September's poor -263,000 jobs reading.
In a related vein, Arnold Kling of EconLog picked up on Altig's post to discuss the difference between a "Keynesian" and "Recalcuation" recession:
In a Keynesian recession, you are temporarily laid off because of excess inventories and deficient aggregate demand. You wait to be recalled by your firm. This was true of recessions from the end of the second World War through the 1980 recession. Even the 1975 recession, which was a "supply shock" (higher oil prices, requiring some permanent readjustments), had a relatively low share of permanent job losses.While Kling meant to support Altig's point, I think Kling's argument actually undercuts that for a "jobless recovery," precisely because the overwhelming share of job losses in the 1991 and 2001 recessions were in manufacturing -- which, due to productivity enhancements and China, never came back. This time around, with over half of the job losses in services, workers do not need to learn a whole new set of skills in order to return to the labor force. What is needed is an increase in real consumer spending, which -- as I have shown in this graph before, and repeat here
In a Recalculation, you permanently lose your job and you have to find something else. The Recalculation model increasingly holds as we move away from an economy dominated by manufacturing. Even though the 1990 and 2000 recessions were relatively mild, a large share of the job losses were permanent.
-- will cause the service jobs to come back afterward.
As a final note, a typically rejoinder to the above, is "where will the spending come from?" As this graph shows, however, consumers have socked away an additional $300 million in the last year in savings.

Some of that was due to fear, and the need to build a fund in case of job loss. A passing of fear will cause some proportion of that saved money to be spent -- and that is where the increase in real consumer spending will come from.
At the end of the day, either the Leading Economic Indicators are right or they are wrong. When Bonddad and I initially blogged about their increase, there was no shortage of skepticism that there would be anything less than a slight deceleration in the ongoing "cliff diving." And yet this week GDP growth of about 3% is likely to be reported. Those indicators strongly indicate that the 4th quarter is likely to be similar. Among the things that Leading Indicators are specifically supposed to lead is the Index of Coincident Indicators -- which as this graph shows, have also now turned up

-- the laggard being job creation, which accounts for just over 50% of the entire Coincident Index. In 1992 and 2002, jobs were finally added to the economy when the LEI were up about 5% YoY. Should the LEI simply move sideways in October and November, they will be close to that 5% YoY mark in December. So I am not yet ready to join in the pessimism.