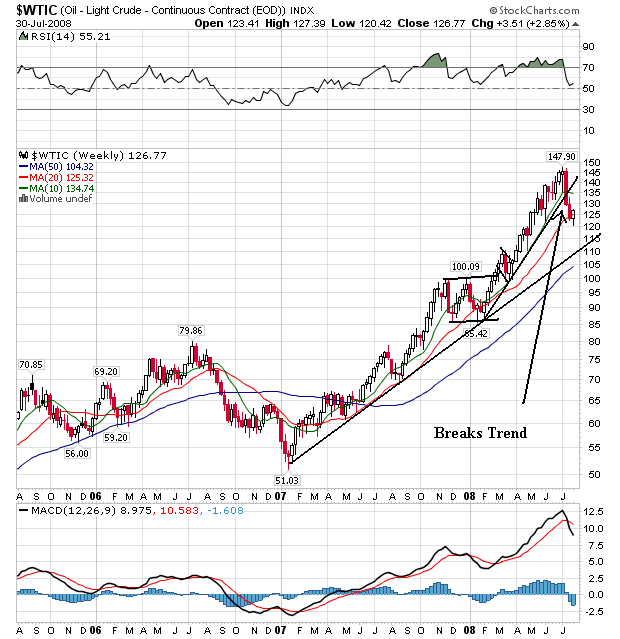
On the weekly chart, we can clearly see the bull market run that started in early 2007. Prices continued to move higher, breaking through resistance levels and then consolidating gains. There are two legs to this rally. The first occurred throughout 2007. This one ended with a sideways rectangle consolidation pattern that lasted about three months. The second move came during 2008. But that move is over. Notice that prices have broken through the trend line that supported the 2008 rally. Prices now stand at the 20 week SMA.
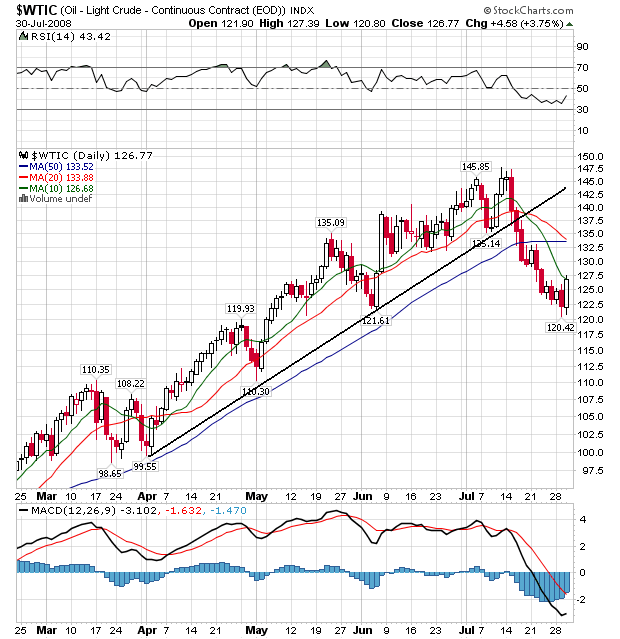
On the daily chart, notice the following:
-- Prices have broken the support line
-- The 10 and 20 day SMA are moving lower
-- The 10 day SMA has moved through the 50 day SMA, and the 20 day SMA is about to
-- The 50 day SMA is leveling off
-- Prices are below all the SMAs
This chart is now short-term bearish and longer term neutral.