This is the Fifth of (da**it!) Seven articles exploring leading indicators for job growth in the economy. So far I have examined:
(1) initial jobless claims, which have until now been declining gradually, and which at their trend rate must decline at least 3 more months before they would get to the point where jobs would be created;
(2) the ISM manufacturing employment data, which is very strong and suggests the jobs could be added to the economy next month, and even possibly now;
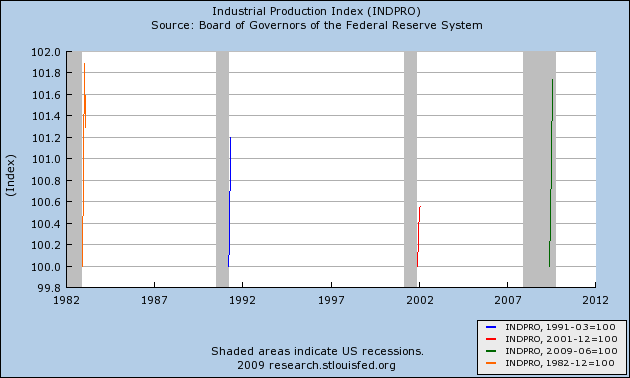
(3) Industrial Production, which even moreso than ISM manufacturing, is suggesting that job growth could happen imminently - but has a very short lead time;
(4) duration of Unemployment, which appears to be of only limited value, to confirm a payroll reading afterward; and
(5) Real retail sales, describing it as the counter-intuitive "Holy Grail" of reliable leading indicators for job growth.
In this part, I want to put together Real retail sales with the other indicators to begin to form a picture of the most likely month(s) at which the economy will start to add jobs
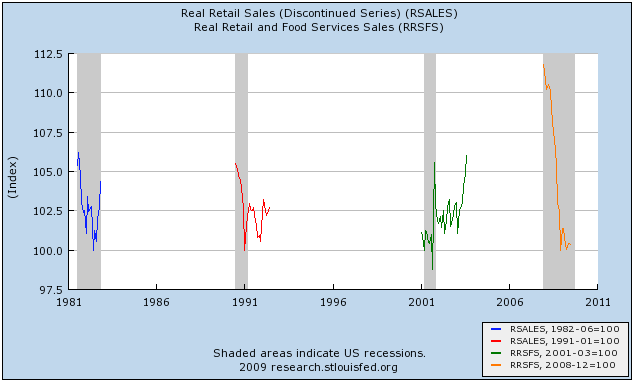
Of the Leading Indicators above, Real retail sales turns first, 5 months from its low, or 3 1/2 months from its smoothed low, on average. Short of the 23 month 2003 outlier, the longest lead time since World War 2 has been 9 months.
Real Retail Sales and Initial Jobless Claims
Which comes next? The answer is, Initial Jobless Claims. Here are graphs of Real Retail sales (in blue) and Initial jobless claims (in green), first for the 1970s recessions:

and here are the 1991 and 2001 "jobless recoveries":

and finally our own recession/incipient recovery:

As is apparent on the graphs, Initial Jobless Claims turn north on average 1-2 months after Real retail sales. Thus they serve as a reliable confirmation that the turn has been made. Also, because they are reported weekly, they can give first notice of the trend of Real Retail sales.
Additionally, as you can see in particular from the last graph, even mid-sized moves within a trend by Real retail sales are usually mimicked by the next month's Initial Jobless Claims -- see for example the late 2005 spike due to Katrina, and a similar, smaller spike in January of this year. Since Real retail sales soared in August due in large part to "cash for clunkers", it should be no surprise that Initial Jobless claims have fallen in each of the last two weeks, and may well continue to do so for several more.
Additionally, as you can see in particular from the last graph, even mid-sized moves within a trend by Real retail sales are usually mimicked by the next month's Initial Jobless Claims -- see for example the late 2005 spike due to Katrina, and a similar, smaller spike in January of this year. Since Real retail sales soared in August due in large part to "cash for clunkers", it should be no surprise that Initial Jobless claims have fallen in each of the last two weeks, and may well continue to do so for several more.
Real Retail Sales and Industrial Production
In all recoveries except for 1949 and 2002, both Real Retail Sales and Industrial Production were growing together, and Job growth started within 2 months of both moving up.
In 1949, however, even though Real Retail Sales grew at a very slight rate throughout the recession, Industrial Production declined. Once both started to grow again, so did Jobs within several months thereafter:

And in 2002, at first Real Retail Sales grew, but Industrial Production did not. Then Industrial Production grew, but Real Retail Sales did not. As soon as both started to grow together, Jobs finally started to increase:

Now, here is our recession and incipient recovery. Real Retail Sales did not meaningfully grow until August. As per prior recessions, Job losses are converging slightly below 0 during this period of sideways movement. Industrial Production started to grow in July.

In all recoveries except for 1949 and 2002, both Real Retail Sales and Industrial Production were growing together, and Job growth started within 2 months of both moving up.
In 1949, however, even though Real Retail Sales grew at a very slight rate throughout the recession, Industrial Production declined. Once both started to grow again, so did Jobs within several months thereafter:

And in 2002, at first Real Retail Sales grew, but Industrial Production did not. Then Industrial Production grew, but Real Retail Sales did not. As soon as both started to grow together, Jobs finally started to increase:

Now, here is our recession and incipient recovery. Real Retail Sales did not meaningfully grow until August. As per prior recessions, Job losses are converging slightly below 0 during this period of sideways movement. Industrial Production started to grow in July.

Thus, should both Real Retail Sales and Industrial Production continue to advance off the bottom, we should expect jobs to be added quickly, within several months.
Putting together the order of Leading Indicators for job growth, we get:
(1) Real retail sales bottom and turn.
(2) Initial Jobless claims turn.
(3) The ISM manufacturing index turns above 50, i.e., signals actual growth.
(4) Industrial Production turns.
(5) ISM manufacturing index is above 53, ISM employment is at -5 or above, initial jobless claims are at least a sustained 16%-20% off peak, and both Industrial Production and Real retail sales have advanced at a rate of 2.5% or more year-over-year from the bottom.
Items (1) through (4) have already happened. ISM and Real retail are on the cusp of their final signals, meaning job growth could occur as early as October. Industrial production is growing, but not quite at a 2.5% annual rate yet. And initial jobless claims are still only 15% or so off peak, dropping so slowly that it would take at least 3 more months at the current rate for jobless claims to be consistent with job growth.
Recall that I have discussed the strength of past moves, in Real retail sales:

and in Industrial Production:

So, we still have the question, is the upward move strong enough to push the indicators over the final threshold, meaning that job growth has begun?
To add the final parameter, we need to return to Leading vs. Coincident Economic Indicators. That -- and I promise, an actual conclusion -- next in this series. In the meantime, I'm going to post a side note about the 1949 and 2001 recessions, and why I think the recovery won't look like the recovery in 2002-3.